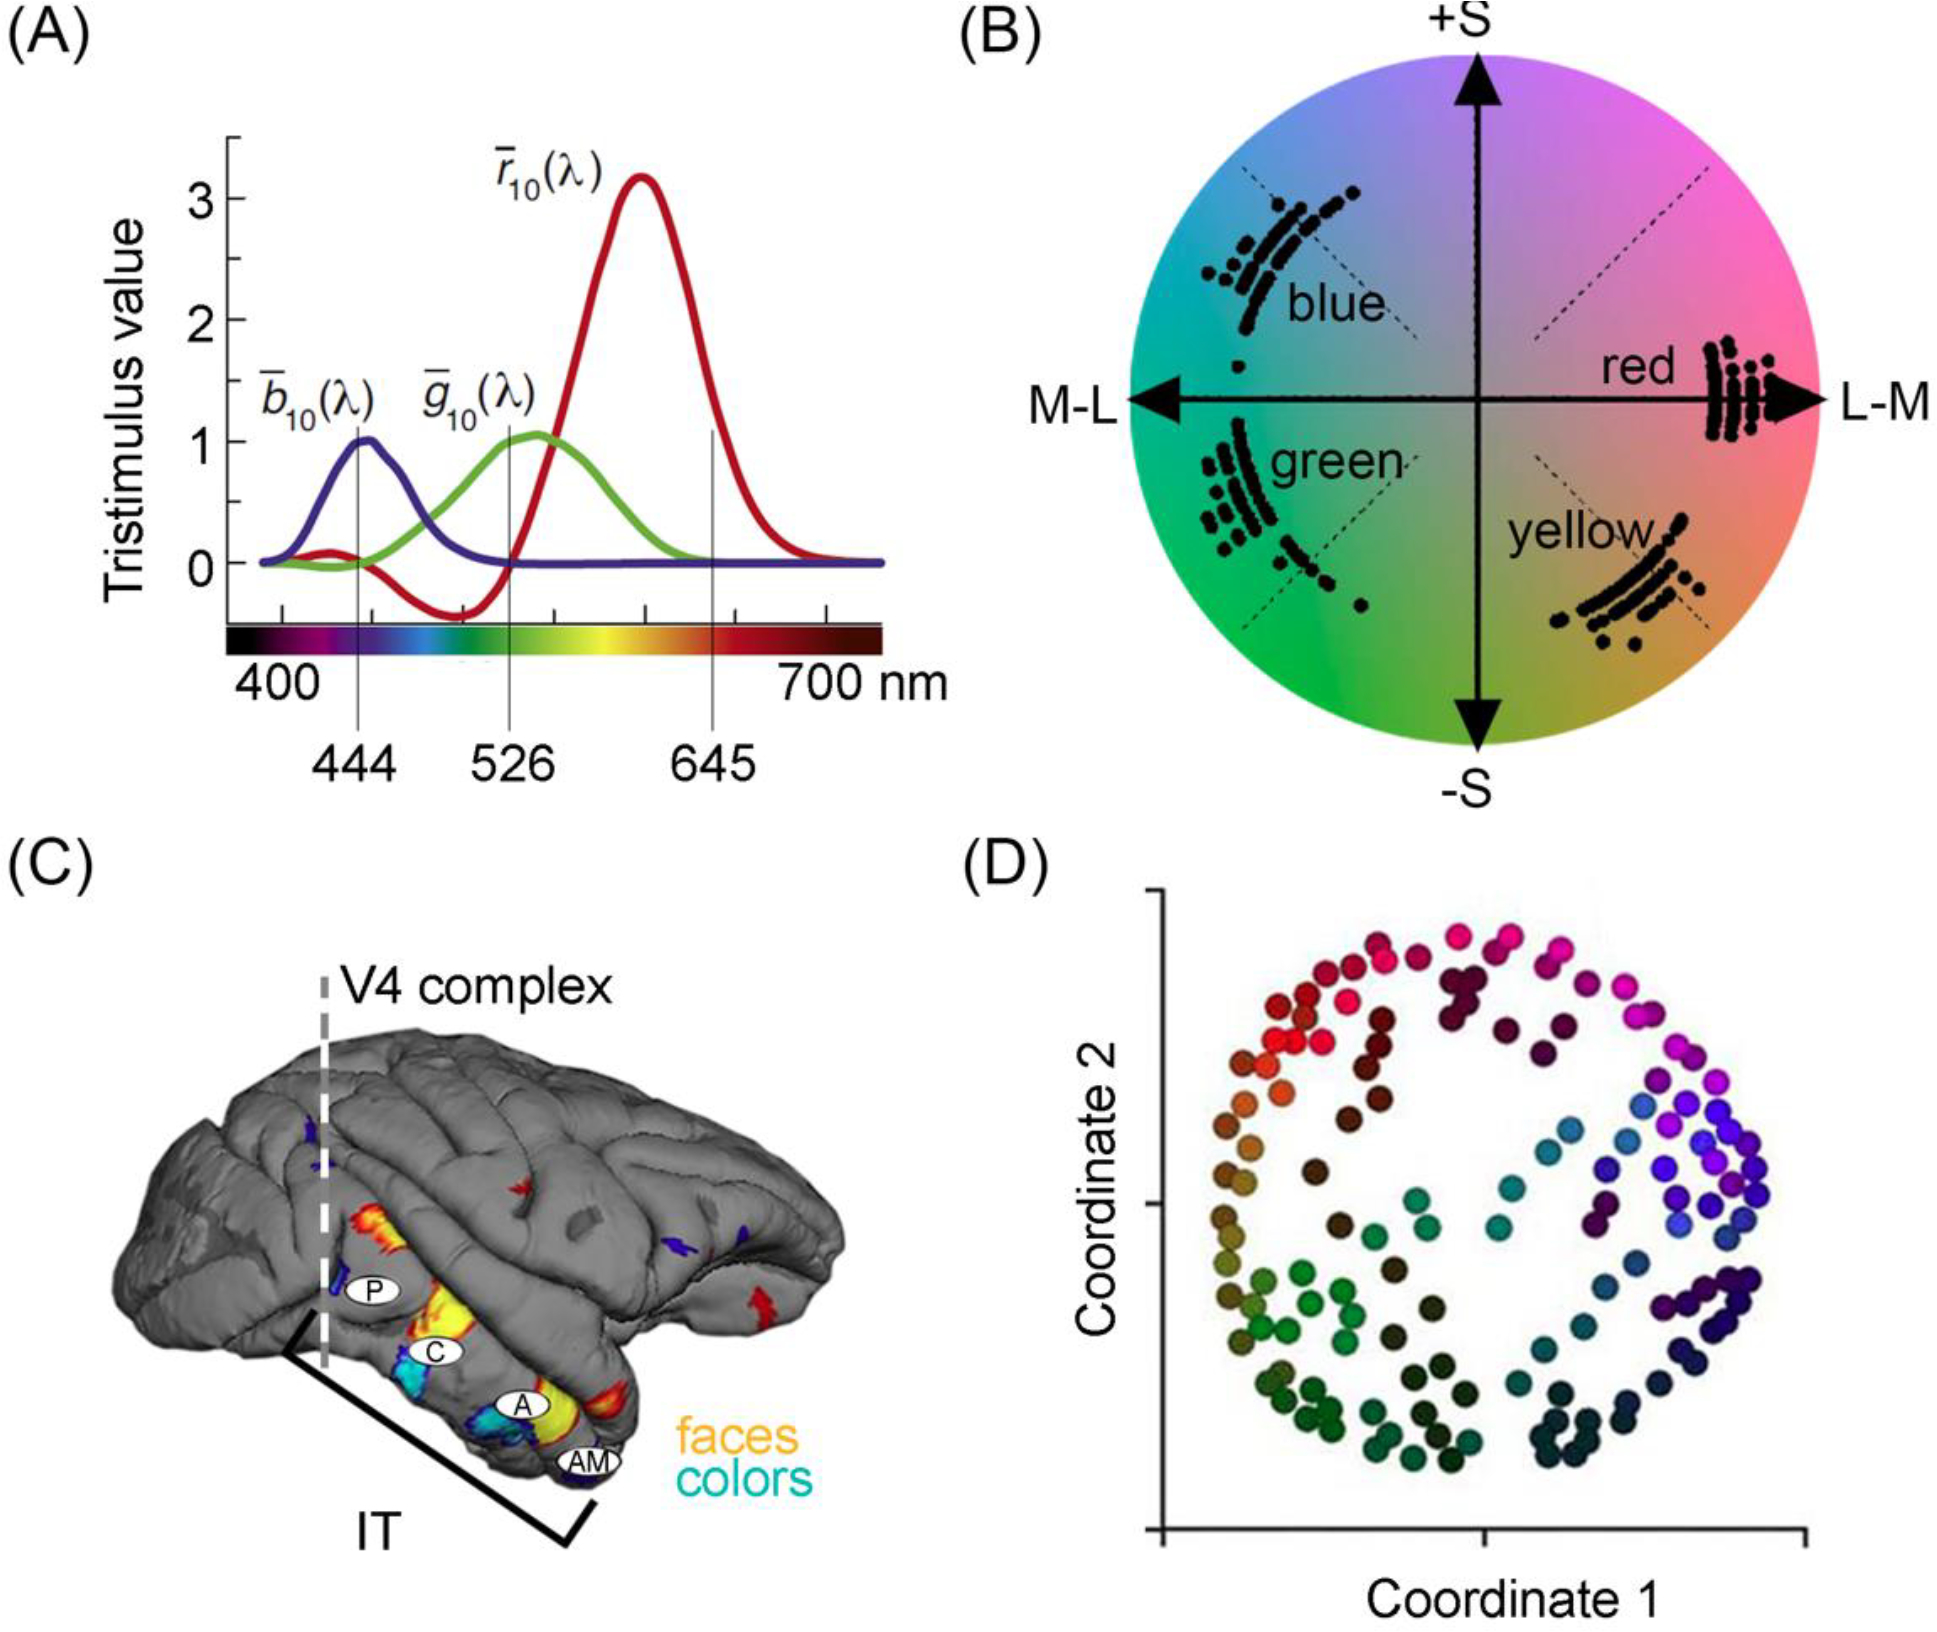
Figure 2. Color encoding and neural representation.

(A). Color matching functions [28]. The y-axis shows the value of each of three primary lights (444nm, 526nm, 645nm) required to match each monochromatic test light on the x-axis. To match some test lights, the primary must be added to the test not to the other primaries, indicated by negative numbers. Color matching data provide evidence of the essential trichromacy of human color vision. (B) Distribution of unique hue settings for 51 observers projected onto a cone-opponent color space [33]. The axes isolate the two cone-opponent mechanisms of the retina; colors along the x-axis vary only in their L and M modulation; colors along the y-axis vary only in modulation of the S cone. (C). Lateral view of the macaque brain showing functional domains biased for colors and faces, identified with fMRI. The vertical line shows the plane of section of the V4 complex. The white ovals indicate four stages in inferior temporal cortex defined by functional and anatomical data (P, posterior; C, central; A, anterior; AM anterior-medial) [55,59]. The existence of color-biased domains in inferior temporal cortex implies that color depends on high-level perceptual and cognitive operations. (D). Geometry of the neural representation of color for neurons within the color-responsive subcompartments of the V4 Complex, calculated by multidimensional scaling [57]. Stimuli are plotted by the two-dimensional embedding determined by the responses of 300 cells.
