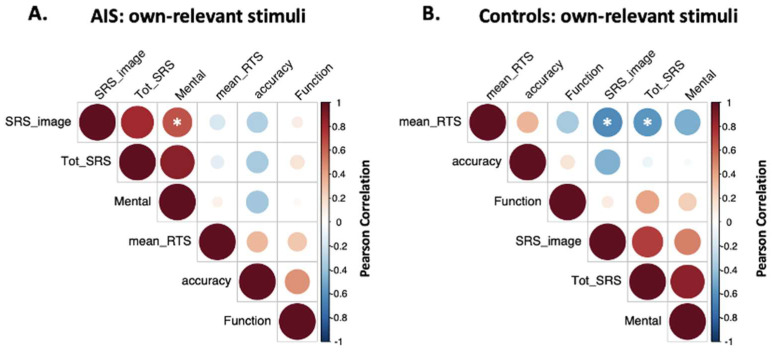
Figure 5.
Correlation matrices. Correlation matrices between questionnaire scores (i.e., SRS_image: SRS-22r self-image domain; Tot_SRS: total score on SRS-22r; Mental: SRS-22r mental domain; Function: SRS-22r function domain), accuracy, and average RTs (i.e., mean_RTS). Subfigure A reports correlations for the AIS group, while subfigure B for the control group. Circles’ dimensions and colors identify the value of the Pearson correlation coefficient, i.e., largest dark red circle indicates maximum positive correlation (1), and largest dark blue circle represents maximum negative correlation (−1) between variables in the two axes. Asterisks indicate significant meaningful correlations.

