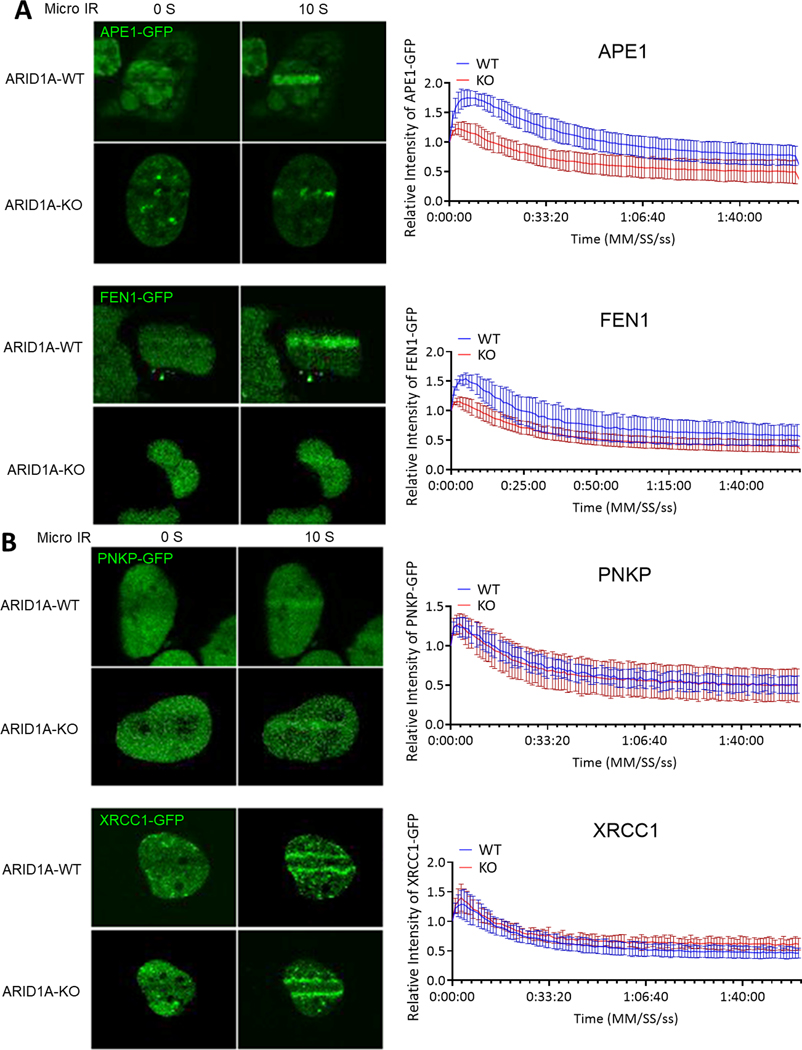
Figure 5. Short patch pathway is not influenced by ARID1A-KO under micro-irradiation (micro-IR).
(A) (Left) Representative live-cell images of hEM3 ARID1A-KO and control cells expressing APE1-GFP and FEN1-GFP at 0 and 10 seconds after micro-IR. (Right) Relative fluorescence intensity at irradiated area measured every second for 2 minutes and plotted as mean ± SEM after normalization to the background fluorescence intensity using Image J. (B) (Left) Representative live-cell images of hEM3 ARID1A-KO and control cells expressing PNKP-GFP and XRCC1-GFP at 0 and 10 seconds after micro-IR. (Right) Relative fluorescence intensity at irradiated area measured every second for 2 minutes and plotted as mean ± SEM after normalization to the background fluorescence intensity using Image J.

