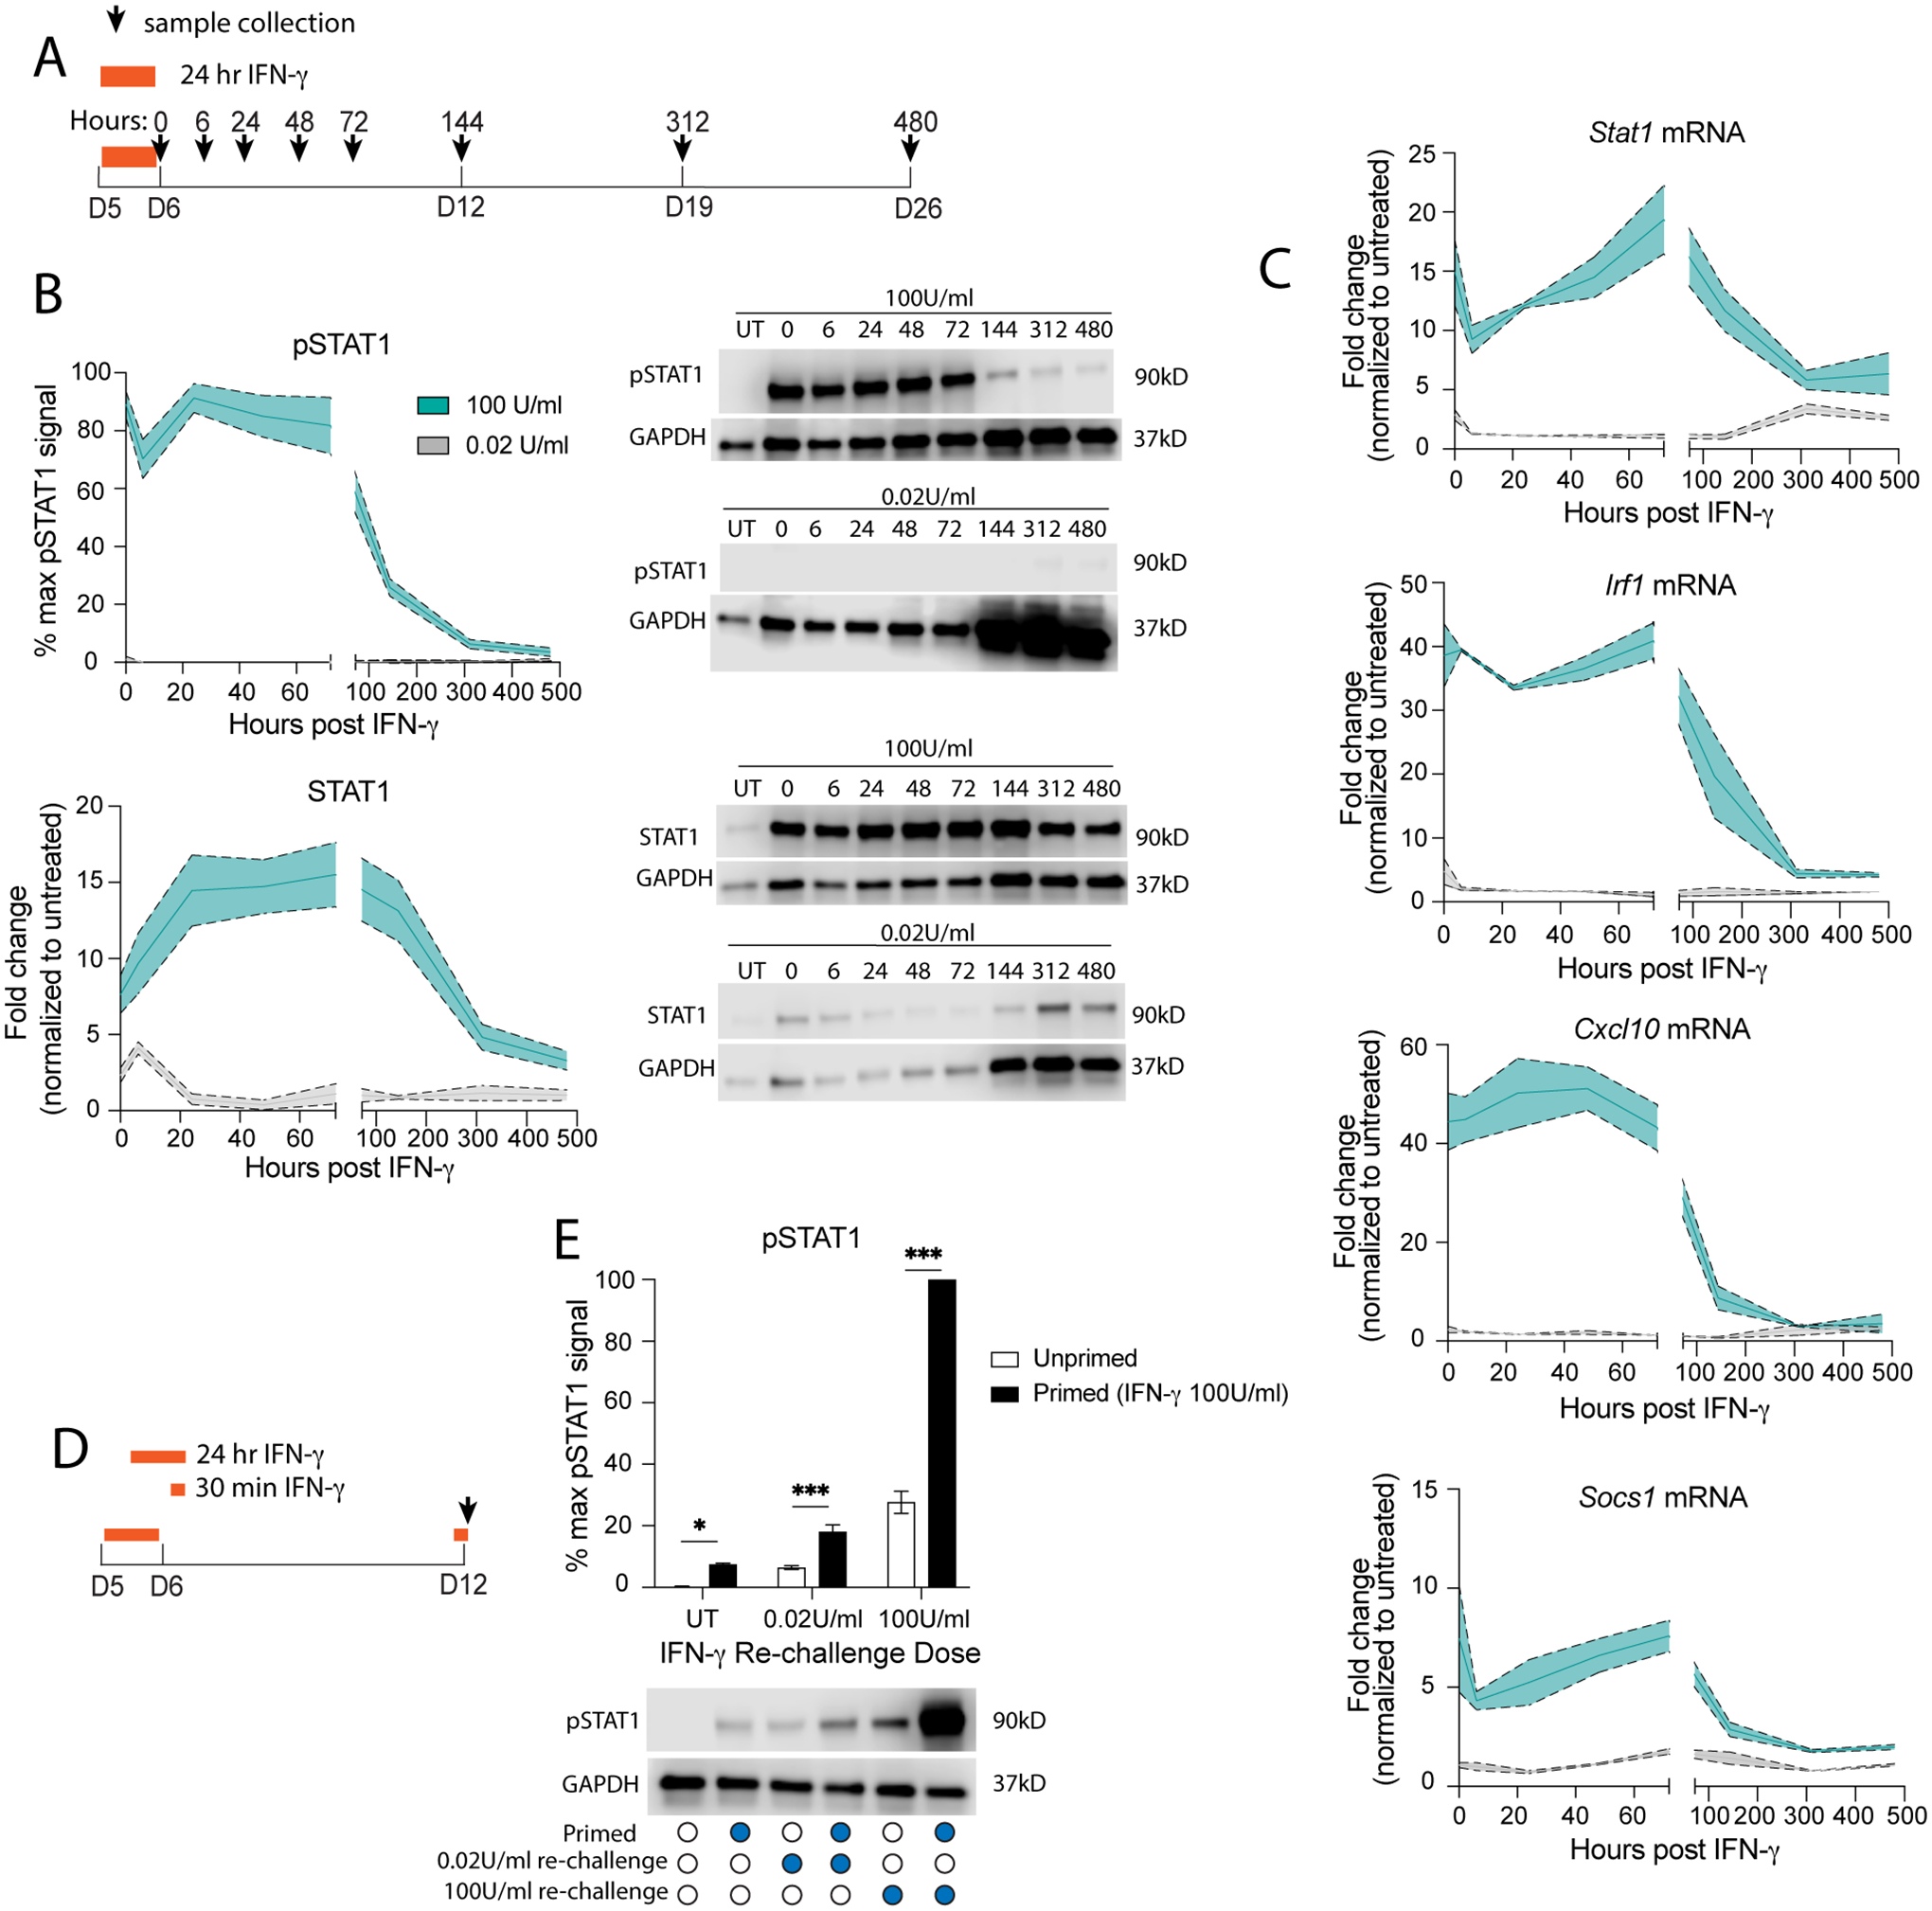
Fig 2. Pathological IFN-γ primes immature neurons to have a heightened STAT1 response in mature neurons.

(A) Primary neurons (DIV5) were treated with physiological (gray; 0.02 U/mL) or pathological levels (cyan; 100 U/mL) of IFN-γ for 24 hours then washed out; (B) pSTAT1 and STAT1 were measured by western blot. (C) mRNA was collected and Stat1, Irf1, Cxcl10, and Socs1 mRNA levels were measured by qRT-PCR. (D) Primary neurons were treated with pathological IFN-γ for 24 hours on DIV5, then rechallenged with physiological or pathological IFN-γ for 30 minutes on DIV12. (E) pSTAT1 levels were measured by western blot. Male and female mice included. Dotted lines represent SEM. (B) Mixed Effects Model, repeated measures: pSTAT1: main effect of time ***p<0.0005 and dose ***p<0.0005, interaction ***p<0.0005, N=2–8; STAT1: main effect of time *p<0.05 and dose ***p<0.0005, interaction ***p<0.0005; N=2–12. (C) Mixed Effects Model, repeated measures: Stat1: main effect of time ***p<0.0005 and dose **p<0.005, interaction ***p<0.0005, N=2–5; Irf1: main effect of time ***p<0.0005 and dose ***p<0.0005, interaction ***p<0.0005, N=2–4; Cxcl10: main effect of time ***p<0.0005 and dose ***p<0.0005, interaction ***p<0.0005, N=2–4; Socs1: main effect of time **p<0.005 and dose ***p<0.0005, interaction **p<0.005, N=2–4. (E) Two Way ANOVA: main effect of priming ***p<0.0005 and restim dose ***p<0.0005, interaction ***p<0.0005; post-hoc Sidak’s multiple comparison: *p<0.05, ***p<0.0005; N=5.
