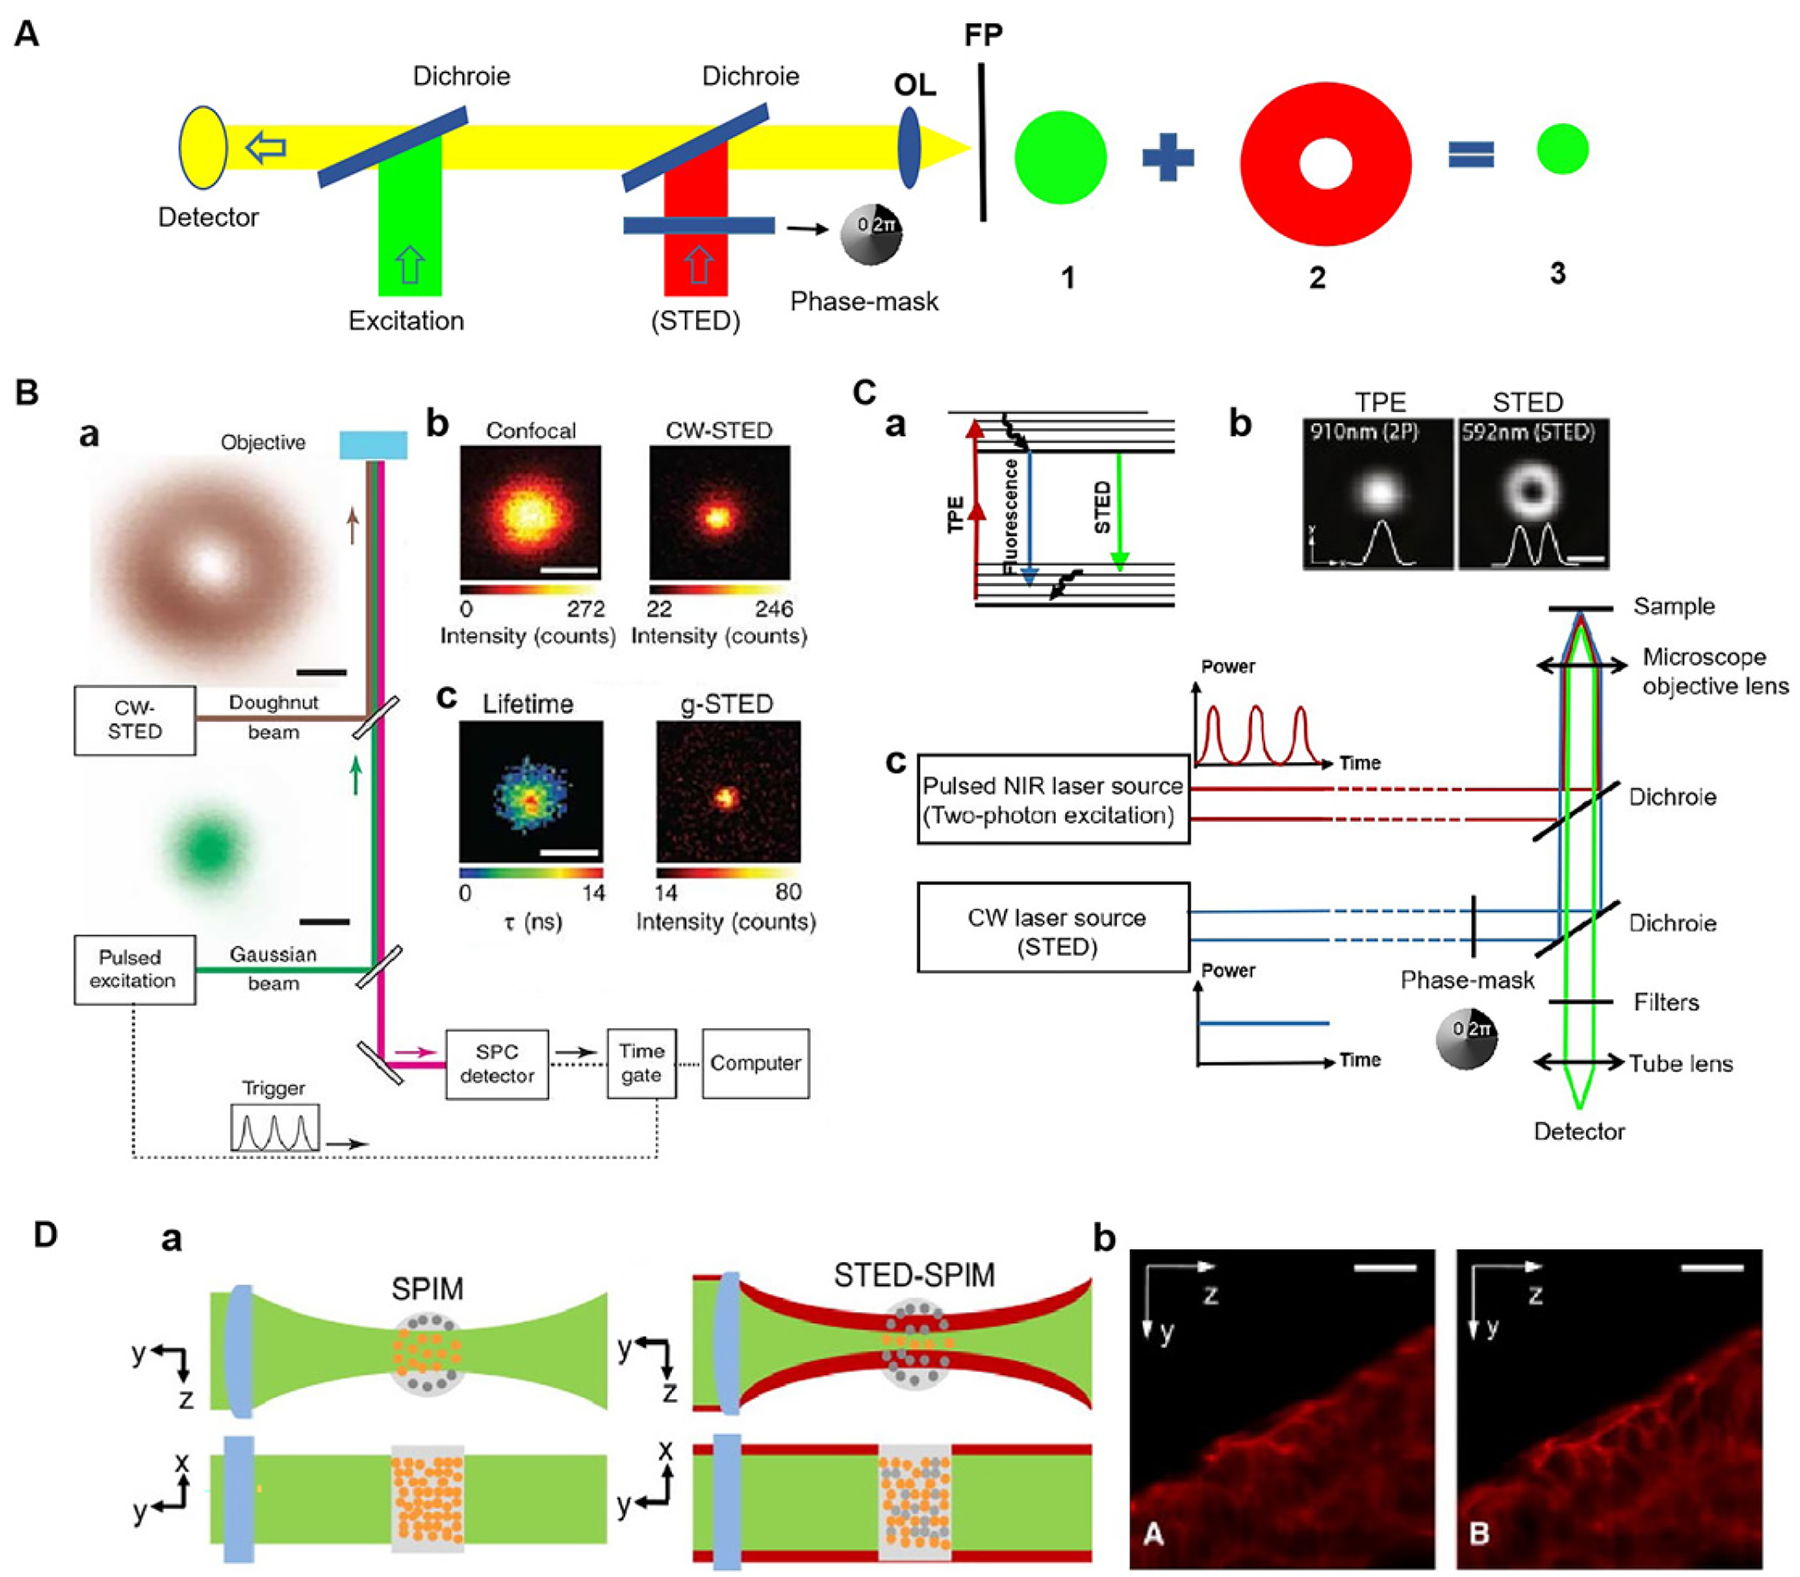
Figure 1.

Principle and application of SRM based on STED microscope. (A) Principle of STED. (B) Principle of g-STED. (a) Microscope setup with pulsed excitation and CW-STED lasers. (b) Fluorescence images of a single isolated NV center for confocal (left) and CW-STED (right, PSTED=47 mW). (c) g-STED (right, Tg=15 ns) and a fluorescence lifetime image for the CW-STED recording (left). Fig. 1B reproduced from Ref [53]. (C) Principles of the reported implementation of TPE-STED microscopy. (a) Energy diagram of the 3 processes involved. (b) Light intensity distribution of the two-photon excitation spot (left) and of the STED doughnut (right) in the focal plan. (c) Setup of TPE-STED. Fig. 1C (b) reproduced from Ref [58]. (D) (a) Principles of SPIM and STED-SPIM. (b) Comparison of SPIM and STED-SPIM imaging of actin in zebrafish embryos stained with ATTO647 phalloidin. Fig. 1D reproduced from Ref [61]. Scale bars: (B) 200 nm, (C) 500 nm, (D) 20 μm.
