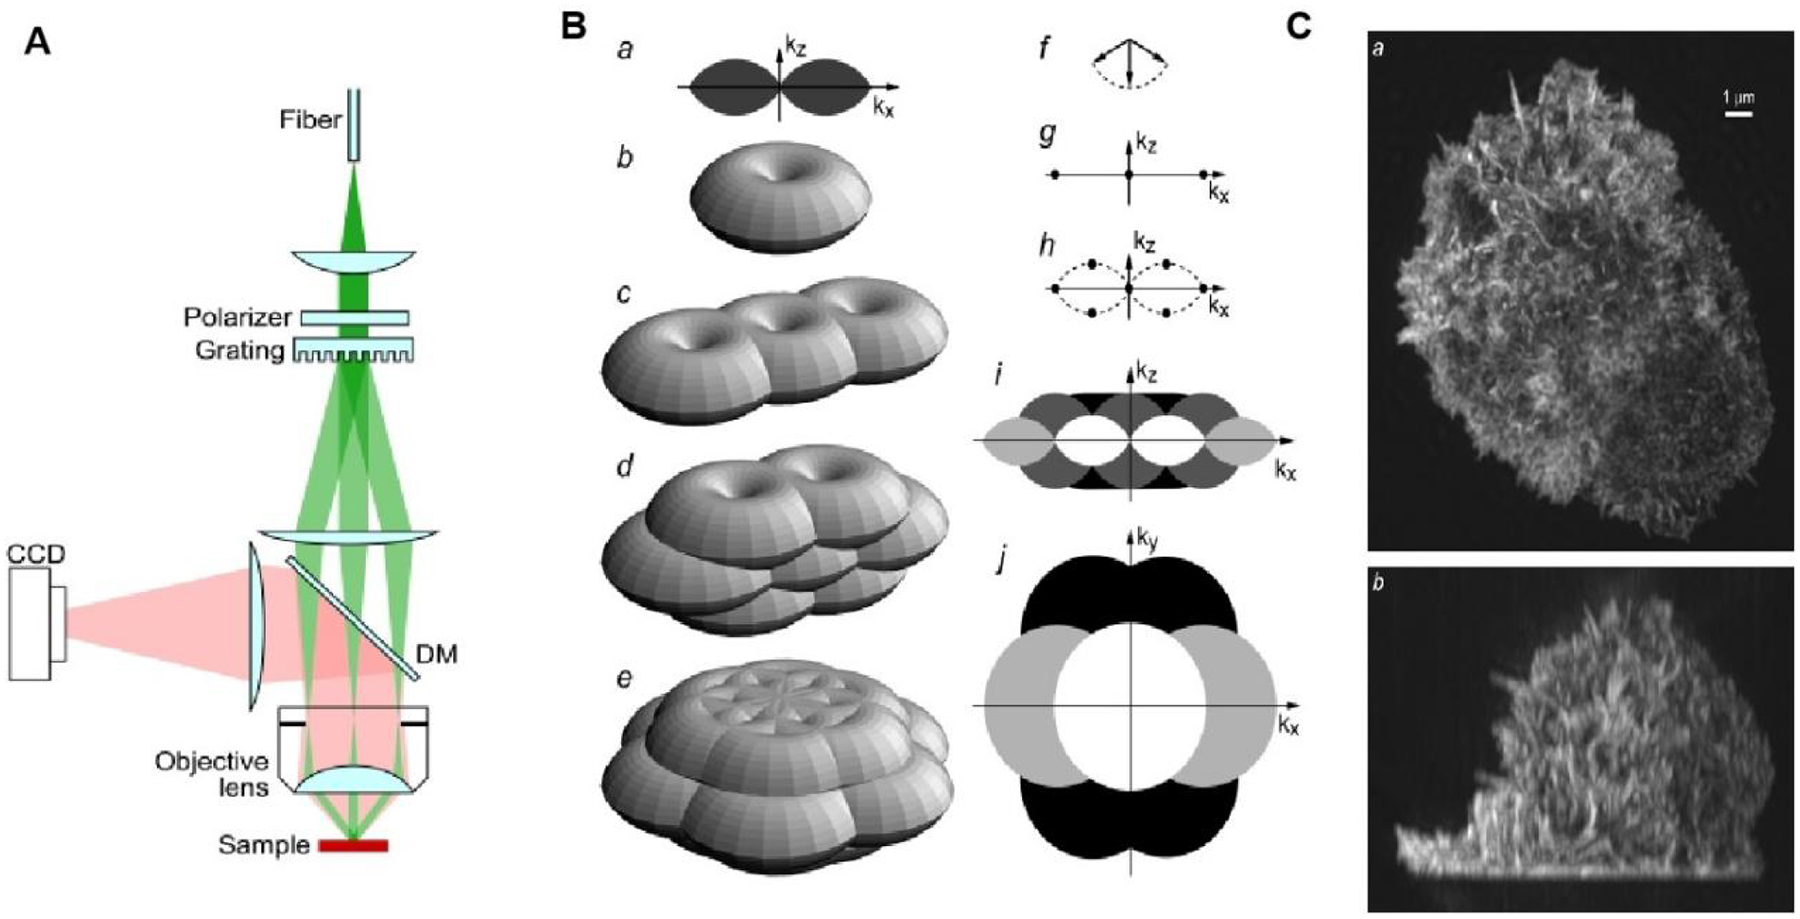
Figure 3.

Principle and application of SRM based on SIM. (A) Simplified diagram of the structured illumination apparatus. Scrambled laser light from a multimode fiber is collimated onto a linear phase grating. Diffraction orders −1, 0 and +1 are refocused into the back focal plane of an objective lens. The beams, recollimated by the objective lens, intersect at the focal plane in the sample, where they interfere and generate an intensity pattern with both lateral and axial structure. (B) Principle of three-dimensional SIM. (a–e) Observable regions for (a and b) the conventional microscope, and for structured illumination microscopy using two illumination beams (c), and three illumination beams in one (d) or three (e) sequential orientations. (f) The three amplitude wave vectors corresponding to the three illumination beam directions. All three wave vectors have the same magnitude 1/l. (g–h) The resulting spatial frequency components of the illumination intensity for the two-beam (g) and three-beam (h) case. The dotted outline in panel h indicates the set of spatial frequencies that are possible to generate by illumination through the objective lens; compare with the observable region in panel a. An intensity component occurs at each pairwise difference frequency between two of the amplitude wave vectors. (i, j): xz (i) and xy (j) sections through the OTF supports in panel b (shown in white), panel c (light shaded), panel d (dark shaded), and panel e (solid). The darker regions fully contain the lighter ones. (C) Maximum intensity projections through a three-dimensional structured illumination reconstruction of the actin cytoskeleton in an HL-60 cell, shown in top view (a) and side view (b). Fig. 3 reproduced from Ref [79].
