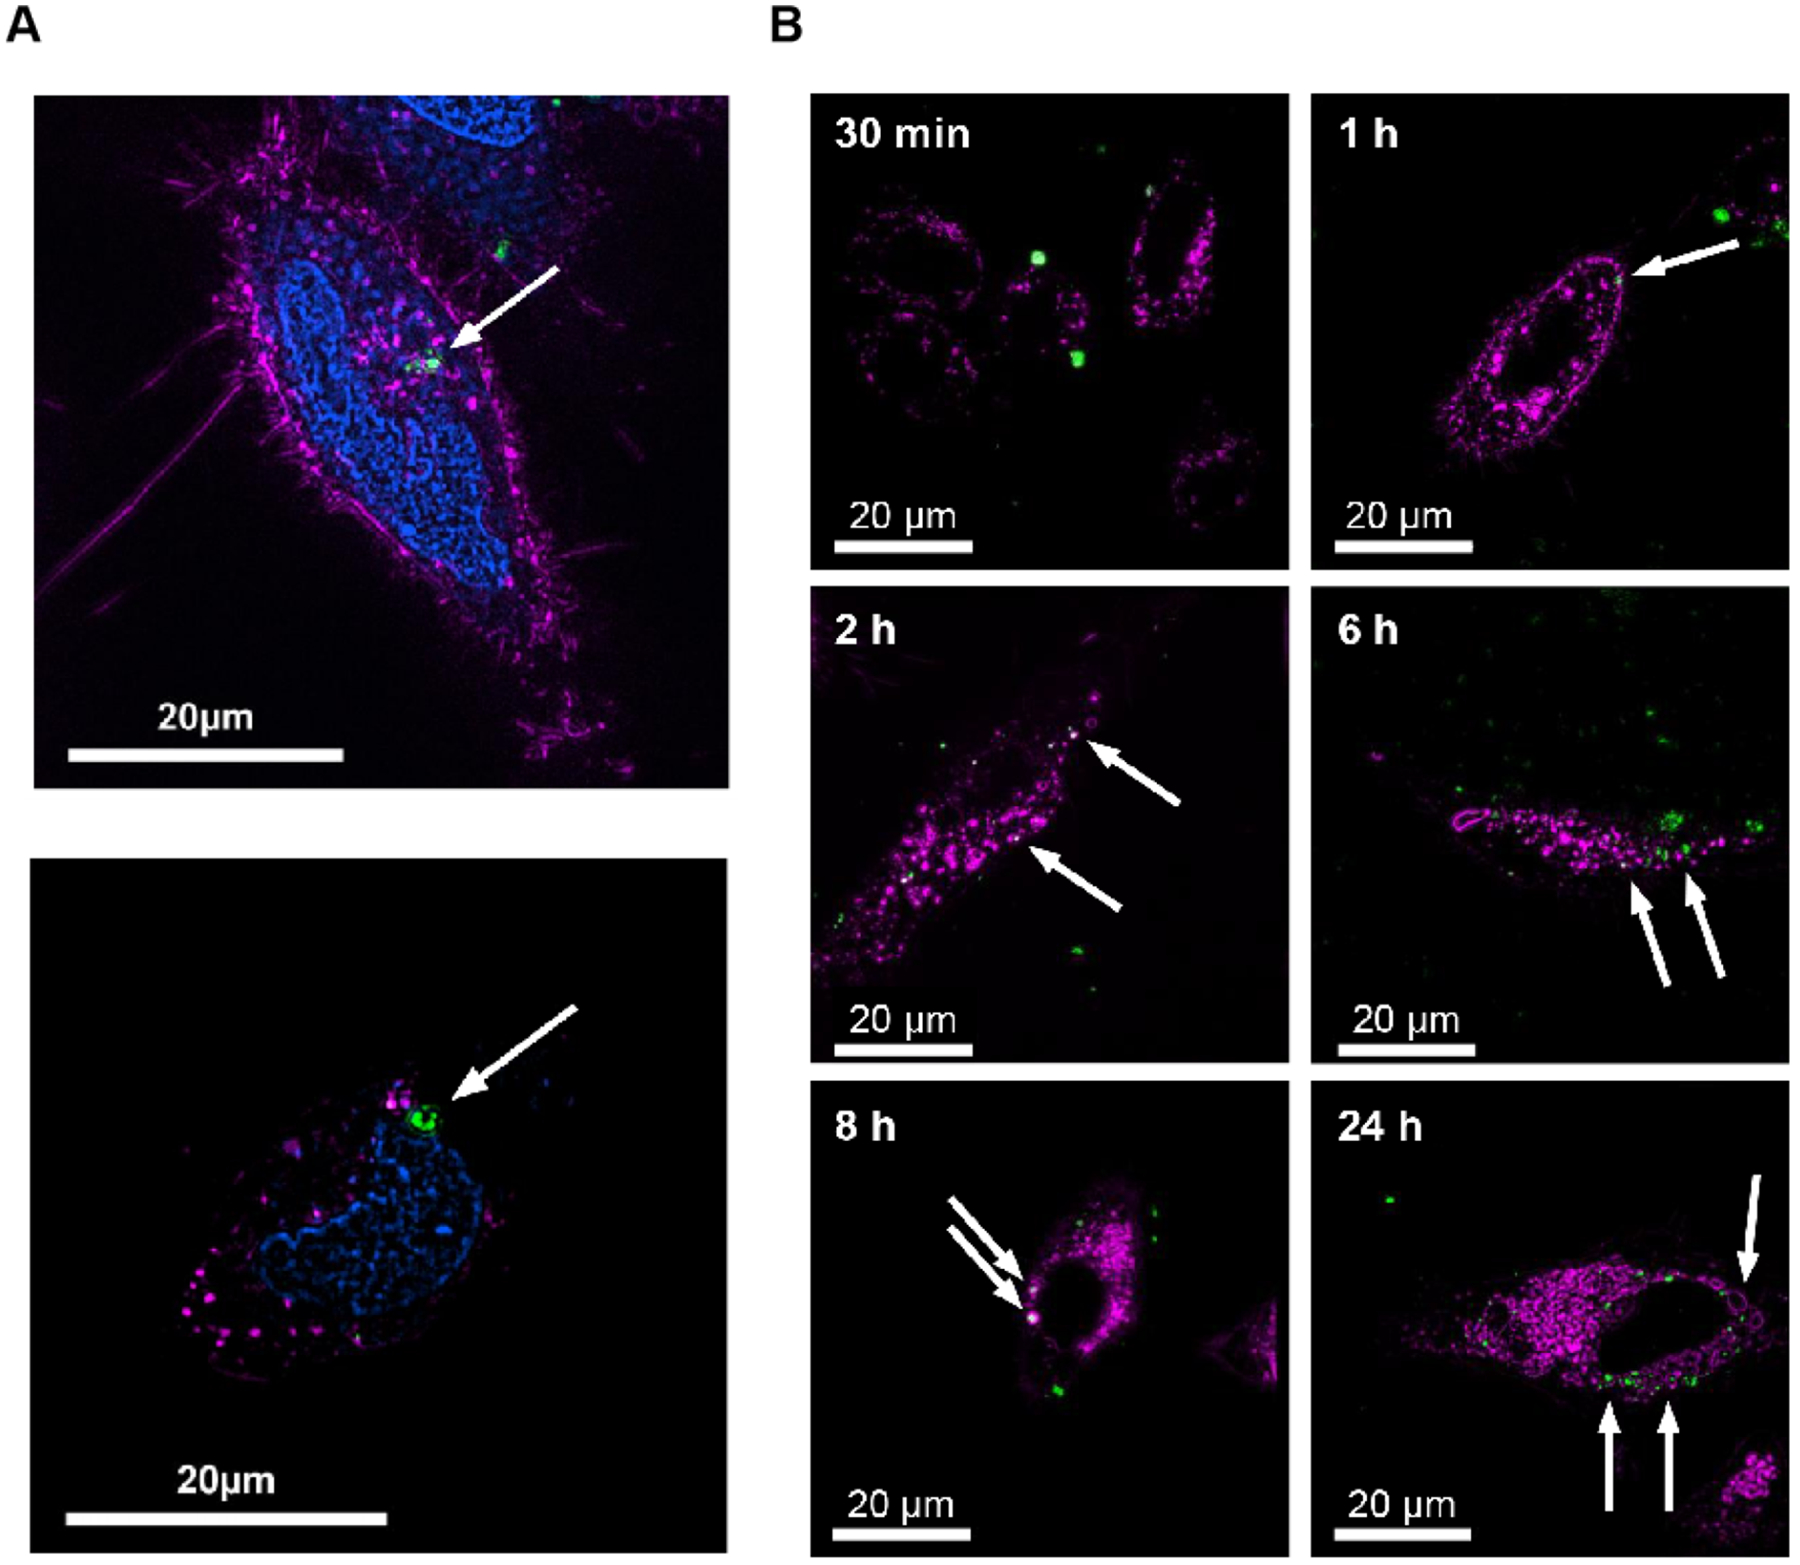
Figure 5.

Super-resolution microscopy techniques for tracking absorption and transport of drug at the subcellular level. (A) SIM 3-color image of HeLa cells demonstrating NU-1000 (150 nm) uptake into cellular boundary. Nucleus colored in blue, early endosomes colored in magenta, NU-1000 colored in green. (B) SIM images of HeLa cells incubated with calcein-loaded temperature-treated NU-901 (cal@t.t.NU-901) at 30 min, 1 h, 2 h, 6 h, 8 h and 24 h. Lysosomes colored in magenta, cal@t.t.NU-901 colored in green. Fig. 5 reproduced from Ref [105].
