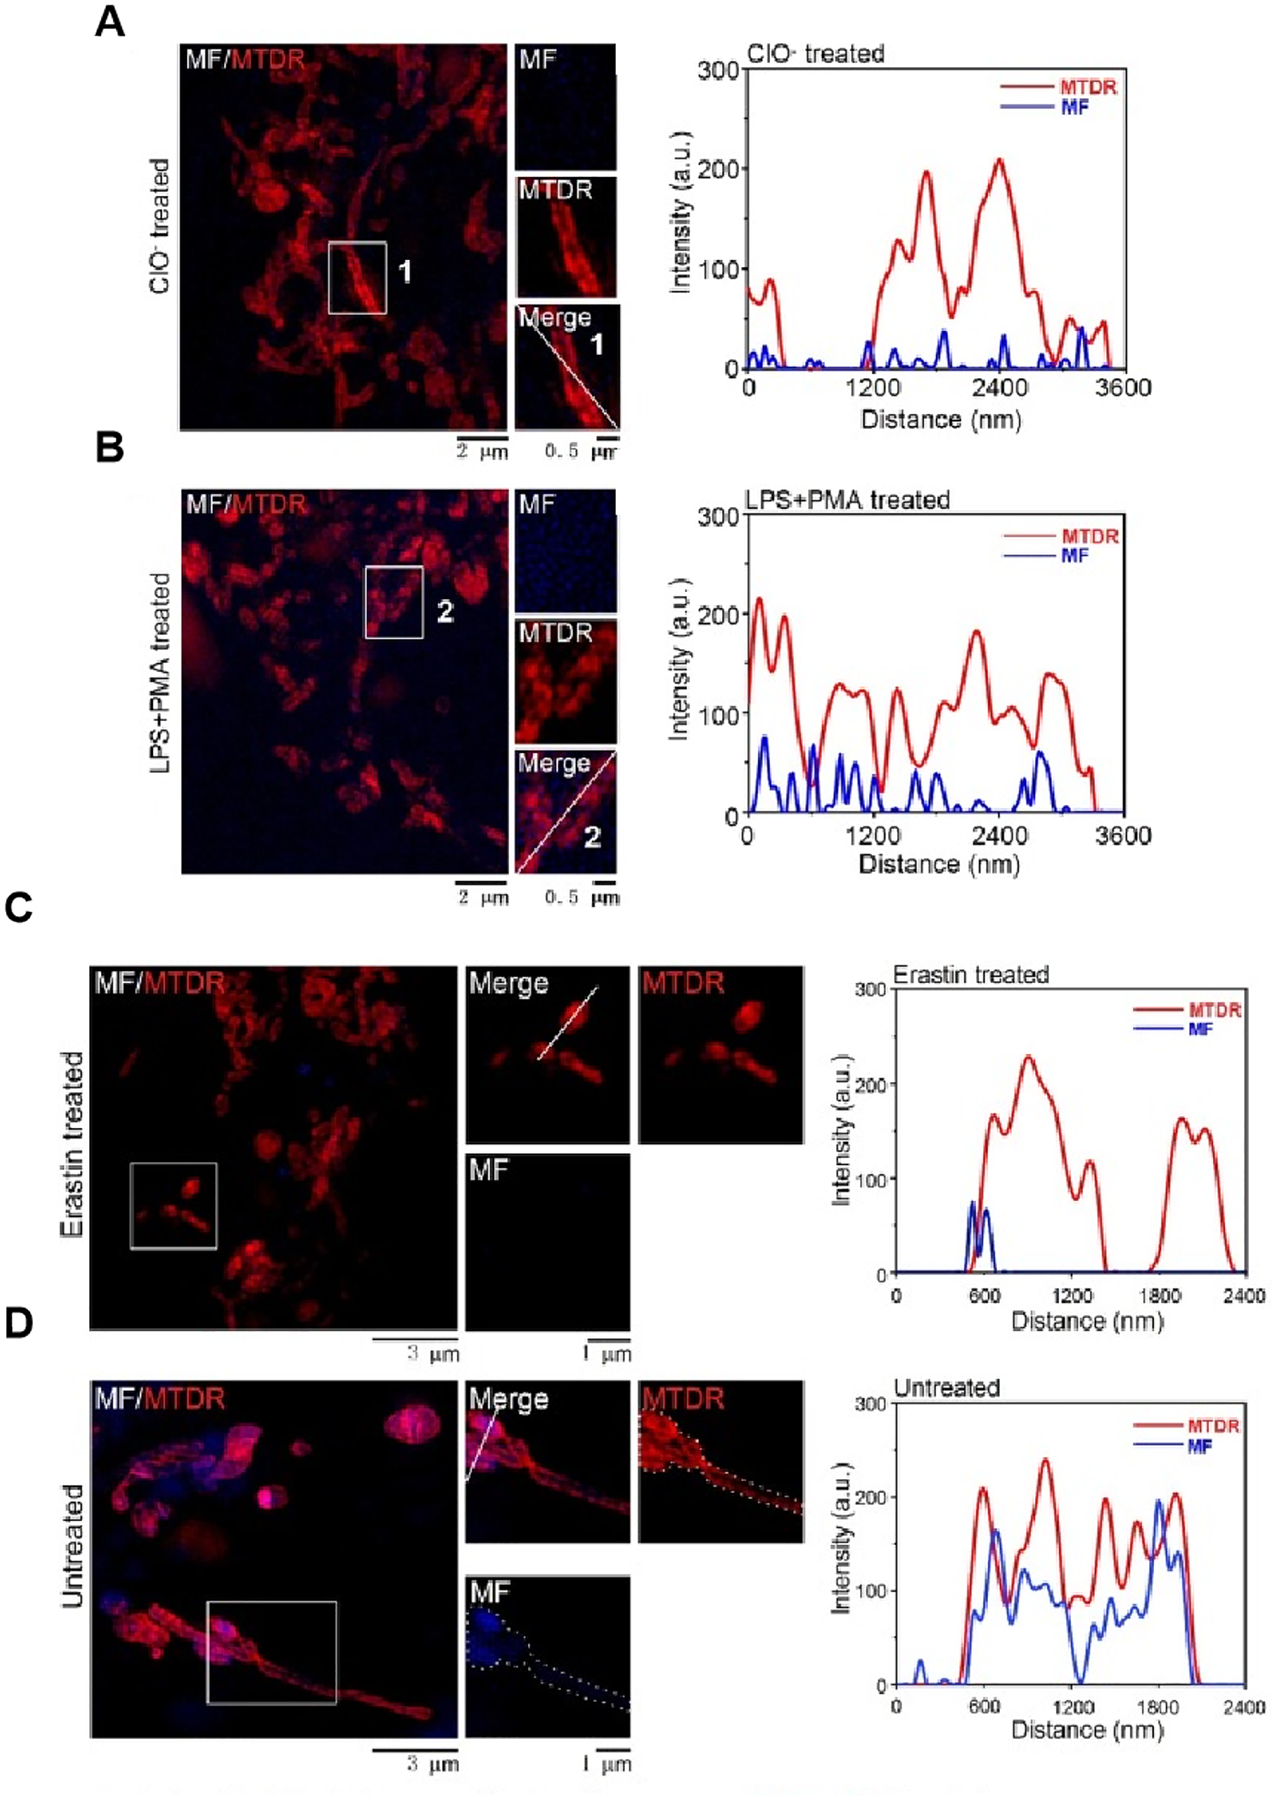
Figure 6.

Super-resolution microscopy techniques for tracking distribution of drug at the subcellular level. (A-B) MF targets the mitochondrial ClO- altering its subcellular distribution. (A) Fluorescence images of mitochondria in HeLa cells incubated with MTDR and MF (10 μM) for 30 min, followed by incubation with exogenous ClO- (50 μM) for another 30 min. (B) Fluorescence images of mitochondria in HeLa cells incubated with lipopolysaccharide (LPS, 1 μg/mL) for 12 h and phorbol myristate acetate (PMA, 1 μg/mL) for 30 min. (C-D) MF show a definite response and bind to its target in ferroptosis. (C) Fluorescence images of mitochondria in HeLa cells incubated with erastin (20 μM) for 12 h and MTDR (λex=640 nm) and MF (10 μM) (λex=405 nm) for 30 min at 37 °C. (D) Fluorescence images of mitochondria in HeLa cells incubated with MTDR and MF (10 μM) for 30 min at 37 °C. Fig. 6 reproduced from Ref [35].
