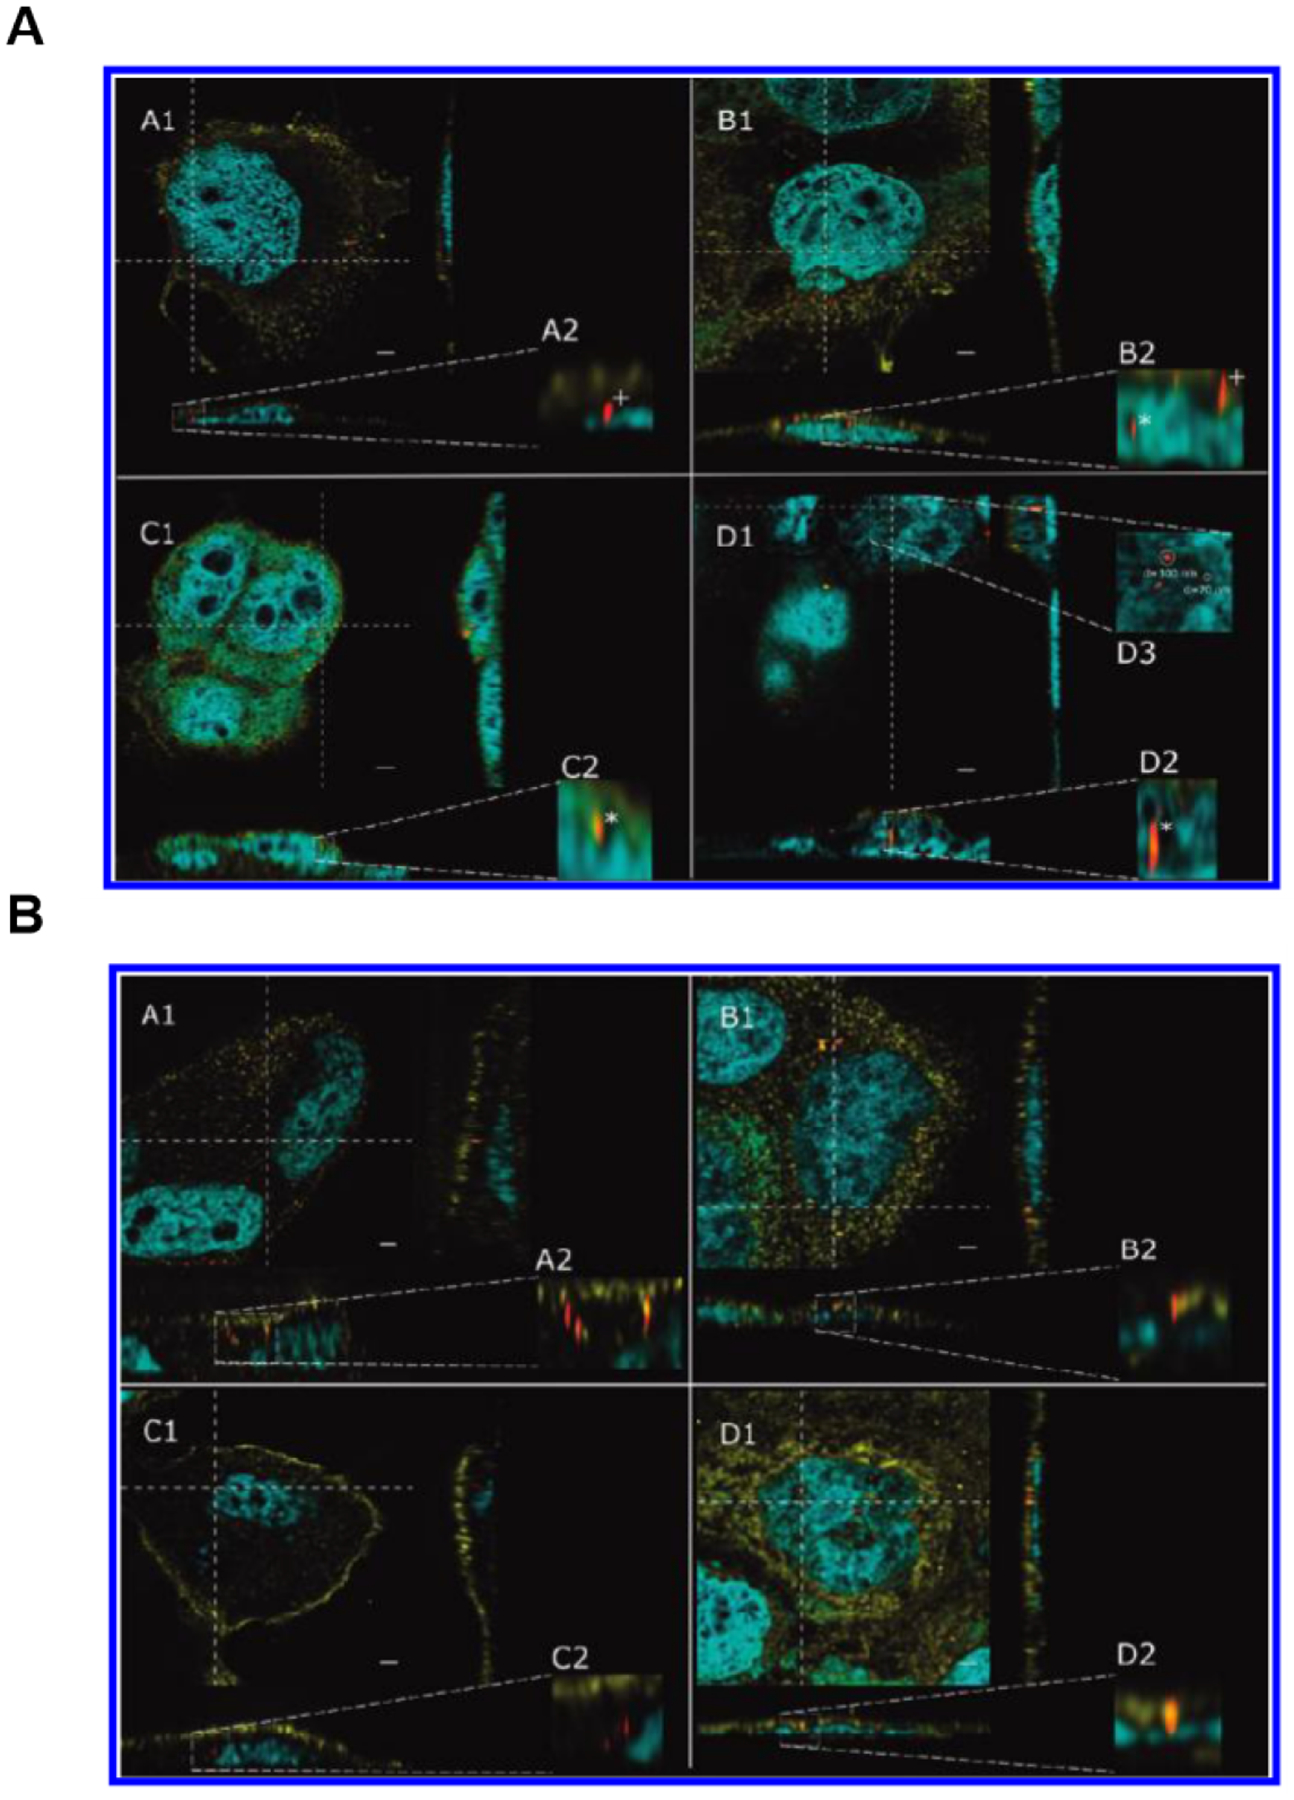
Figure 7.

Super-resolution microscopy techniques for tracking metabolism and excretion of drug at the sub-cellular level. (A-B) High resolution STED confocal fluorescence images of Caco-2 cells incubated with 1 μg mL−1 32 nm silica particles for 3 days. Samples were taken after 5 h (A1), 24 h (B1), 48 h (C1), and 72 h (D1). (A) A2–D2 display enlargements of the orthogonal view to visualize nanoparticles inside (*) and outside (+) the nucleus. D3 depicts an enlargement of the aggregated particles shown in D1. (B) A2–D2 depict enlargements of the orthogonal view to demonstrate that nanoparticles are outside the nucleus. Particles that appear to be localized inside the nucleus in the xy section actually represent signals from an image plane above the nucleus, as can be seen in the enlargements of the orthogonal view (B2 and D2). The nucleus is shown in blue, the cell membrane in yellow, and silica nanoparticles in red. Images are deconvolved and oversaturated for better visualization. The scale bar represents 2 μm. Fig. 7 reproduced from Ref [106].
