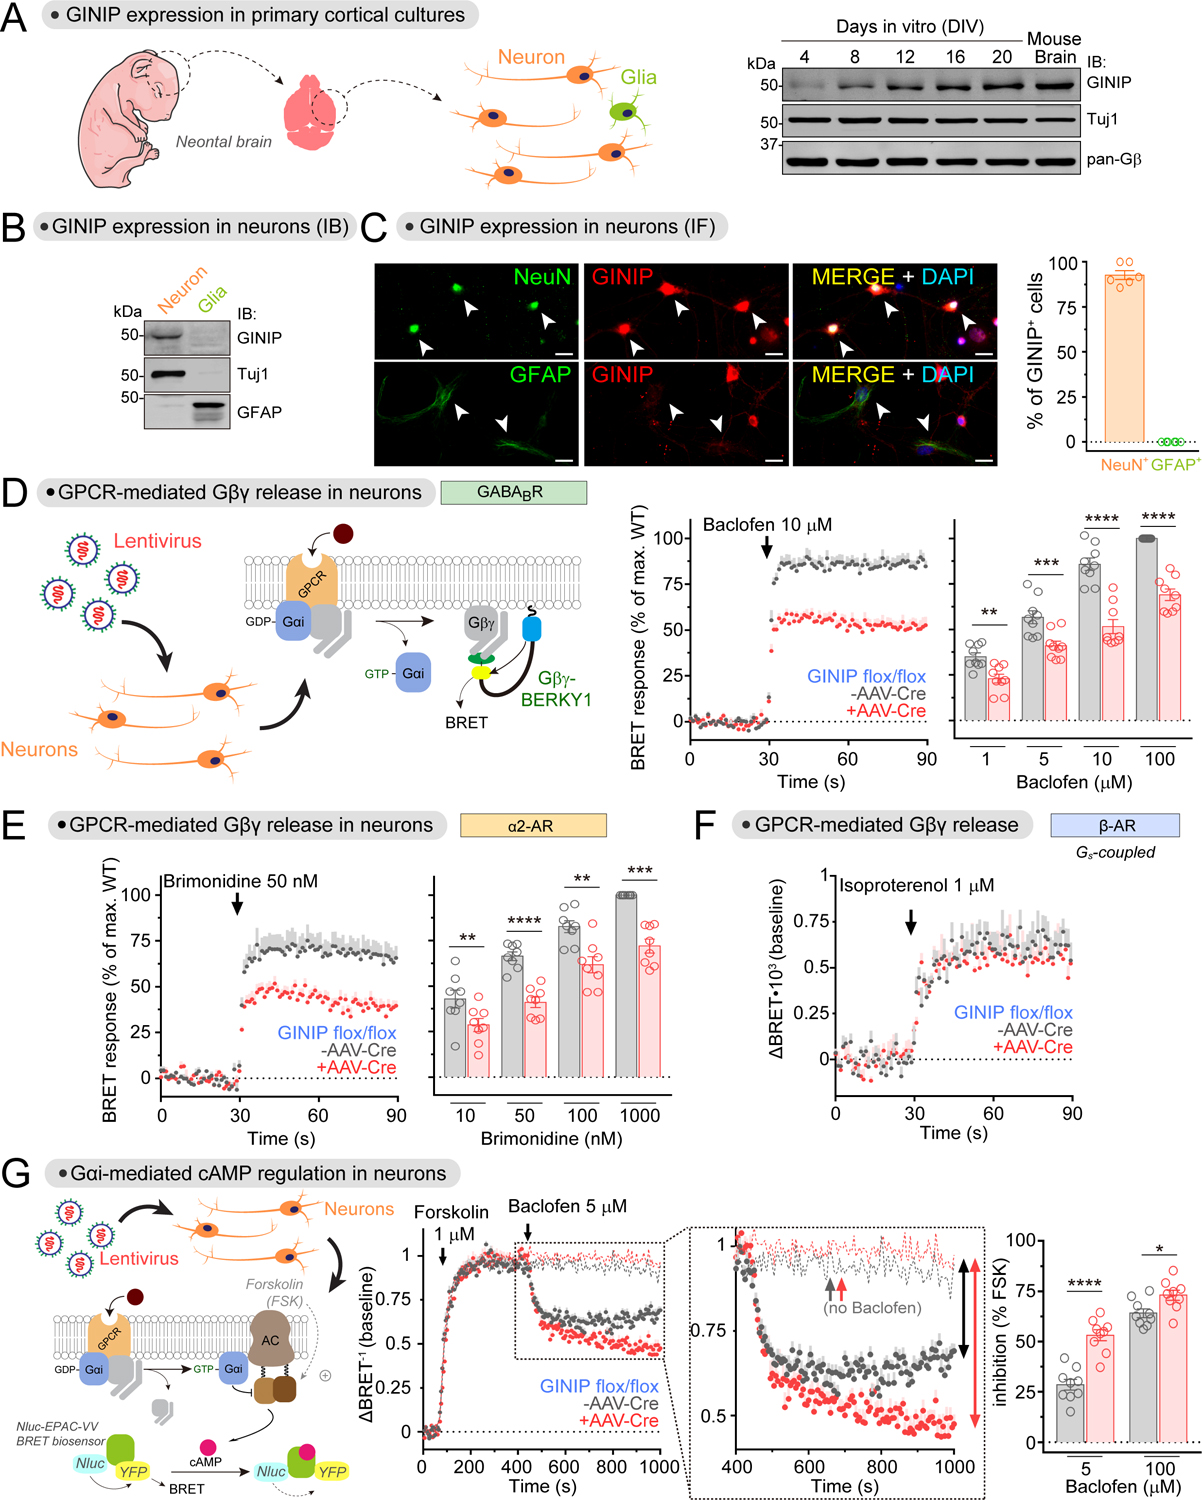
Figure 5. GINIP regulates Gi-coupled GPCR signaling in neurons.

(A) GINIP is expressed in cortical neuron cultures. Neuron cultures established from the cortices of neonatal mouse brains were analyzed by immunoblotting (IB) on the indicated days in vitro (DIV). n=2.
(B) GINIP is not expressed in cortical glial cultures. Neuron and glial cultures established from the cortices of neonatal mouse brains were analyzed by immunoblotting (IB) on DIV12. n=3.
(C) GINIP is expressed in cortical neurons but not in glia. GINIP was co-stained with NeuN or GFAP in DIV12 cortical cultures. Arrows indicate NeuN+ or GFAP+ cells. The proportion of GINIP+ in NeuN+ or GFAP+ cells was quantified from three independent cultures (two image fields per experiment). Mean±S.E.M. Scale bar = 20 μm.
(D, E) Loss of GINIP decreases Gβγ responses triggered by GABABR (D) and α2-AR (E). BRET was measured in DIV12–14 cortical neurons from GINIP flox/flox mice that had been transduced (red) or not (black) with AAV-Cre. BRET responses were normalized to the maximum response of WT in each experiment. Mean±S.E.M., n=8–9. **p<0.01, ***p<0.001, ****p<0.0001, paired t-test.
(F) Loss of GINIP does not affect Gβγ responses triggered by β-AR. BRET was measured in DIV12–14 cortical neurons as in D and E. Mean±S.E.M. n=5
(G) Loss of GINIP enhances the inhibition of adenylyl cyclase upon stimulation of GABABR. cAMP was measured by BRET in DIV16–18 cortical neurons from GINIP flox/flox mice that had been transduced (red) or not (black) with AAV-Cre. Dotted lines in the kinetic traces indicate controls not stimulated with baclofen. Mean±S.E.M., n=9. *p<0.05, ****p<0.0001, paired t-test.
See also Figure S5
