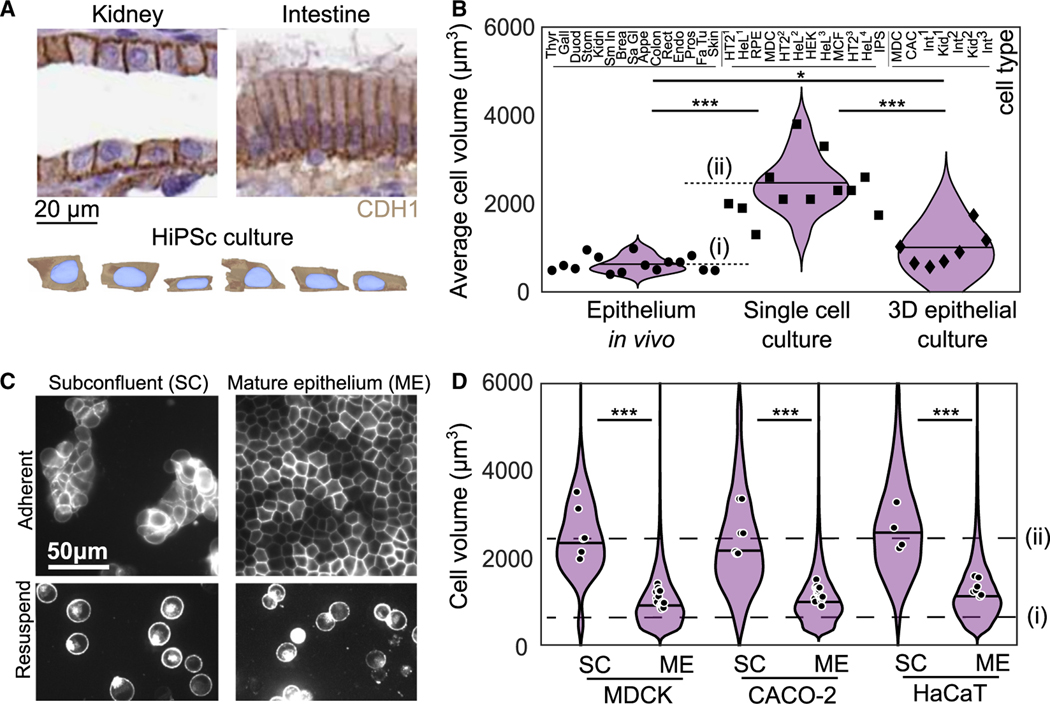
Figure 1. Epithelial cell size is consistent across tissues but context dependent.
(A) Histology sections published by the Human Protein Atlas showing E-cadherin (CDH1) staining kidney and intestine (duodenum) tissue (image credit: Human Protein Atlas) and human induced pluripotent stem cell (HiPSc) segmentation data from Allen Cell Institute (available from allencell.org/3d-cell-viewer). In all images cells are displayed in cross-sectional view with the apical-basal axis vertical.
(B) Cell volume from 15 tissues in vivo (circles), 12 published measurements from cell lines cultured as single cells (squares), and 7 measurements from 3D epithelial cell cultures (diamonds). Each data point is the average cell size from >50 cells for a given cell type. Measurement details available in Table S1. Dashed lines show the average cell volumes from epithelium in vivo (i) and in single-cell culture (ii).
(C) (Top) Images of MDCK cells with fluorescently labeled cell membranes (stargazin-gfp) in subconfluent colonies (SCs) and mature epithelium (ME). (Bottom) Cells under each condition are also shown after being treated with trypsin for 10 min and resuspended.
(D) Cell volume in SC and ME for MDCK, CaCo-2 and HaCaT cell lines. Violins show the distribution of cell volumes pooled from all experiments, solid line shows median of this cell-volume distribution, and points show the mean volume of each experimental replicate. Dashed lines show the average cell volumes from epithelium in vivo (i) and in single-cell culture (ii) from (B) . *p < 0.05, ***p < 0.001 from comparison of experimental or sample means. See also Figures S2–S4 and Table S1.

