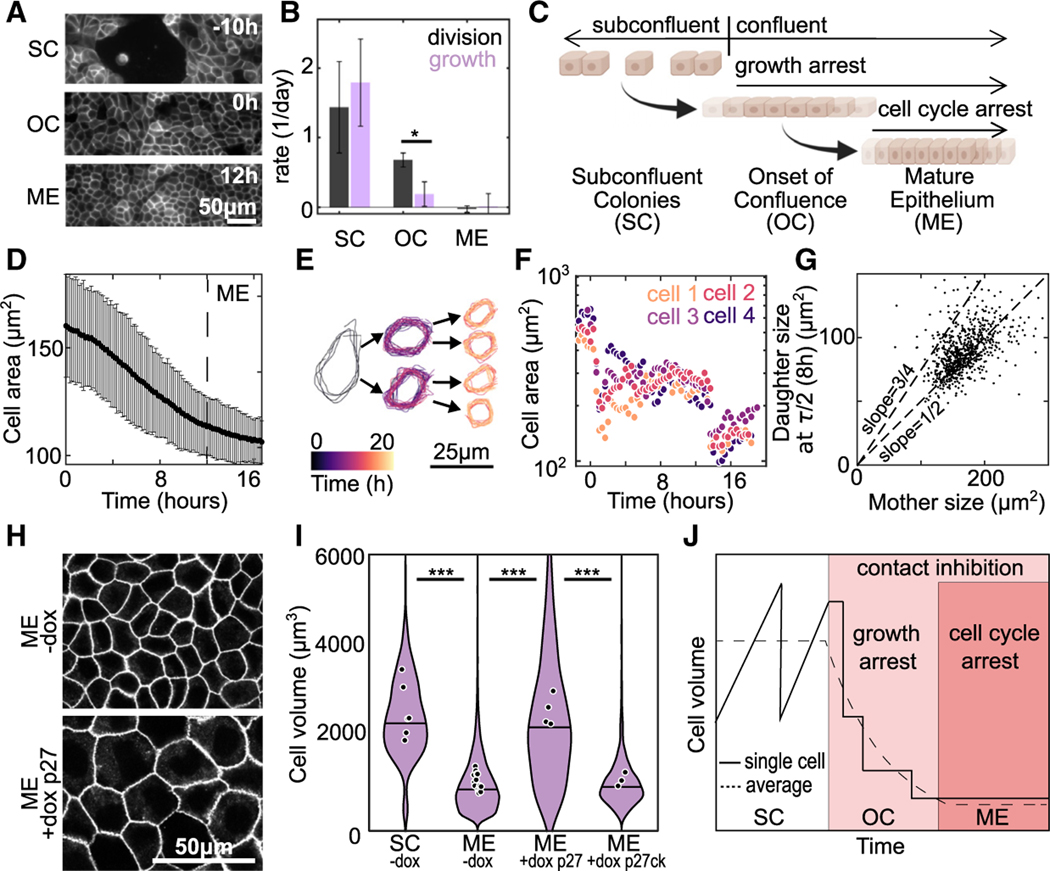
Figure 2. Division during growth arrest at the onset of confluence leads to cell-size reduction.
(A) Images of MDCK cell membranes at time points during the transition from subconfluent colonies (SCs) (t = −10 h) to mature epithelium (ME), the time point when cell density reaches a plateau (t = 12 h) (Figures S2B–S2D). The data are aligned such that onset of confluency (OC), the time point when cell first occupy all space on the substrate, occurs at h.
(B) Average rates of cell division (black) and growth (purple) at SC, OC, and ME. For growth data change total protein from lysates was measured by bicinchoninic acid (BCA) assay. Error bars are SD of three experiments. For division rate, the change in cell number was determined by a cell counter. Error bars are the SD of three experiments.
(C) Schematic summarizing result that, at the onset of confluence, there is a temporal decoupling of growth and cell-cycle arrest.
(D) Average cell area over time, is OC. Error bars are SD of 30 fields of view each containing >500 cells; time at which ME forms indicated by dashed line.
(E) Outline of a representative cell, and subsequent daughter cells, over the experiment.
(F) Areas of 4 representative cells over the course of the experiment. Traces are shifted in time so that the first cell division occurs at time 0 for all cells.
(G) Area of daughter cell 8 hours through the cell cycle versus the area of mother cell (n = 758 cells from 1 experiment. Linear fit slope = 0.52).
(H) Images of cell membrane at t = ME + 3 days in monolayers formed from Tet-On P27 cells. ME were formed under control conditions (−dox) or with the cell cycle inhibited (+dox p27) by the addition of doxycycline at h.
(I) Cell volumes in SC and ME with Tet-On p27 or Tet-On p27ck (non-cell cycle inhibiting control) in control conditions (−dox) or in ME with doxycycline added at h. SC and ME −dox data also displayed in Figure 1D ( [N=6], [N=17], [N=4], and [N=3]).
(J) Schematic of the mechanism of cell-volume regulation during the transition from SC to ME (*p < 0.05, ***p < 0.001 from comparison of experimental means).

