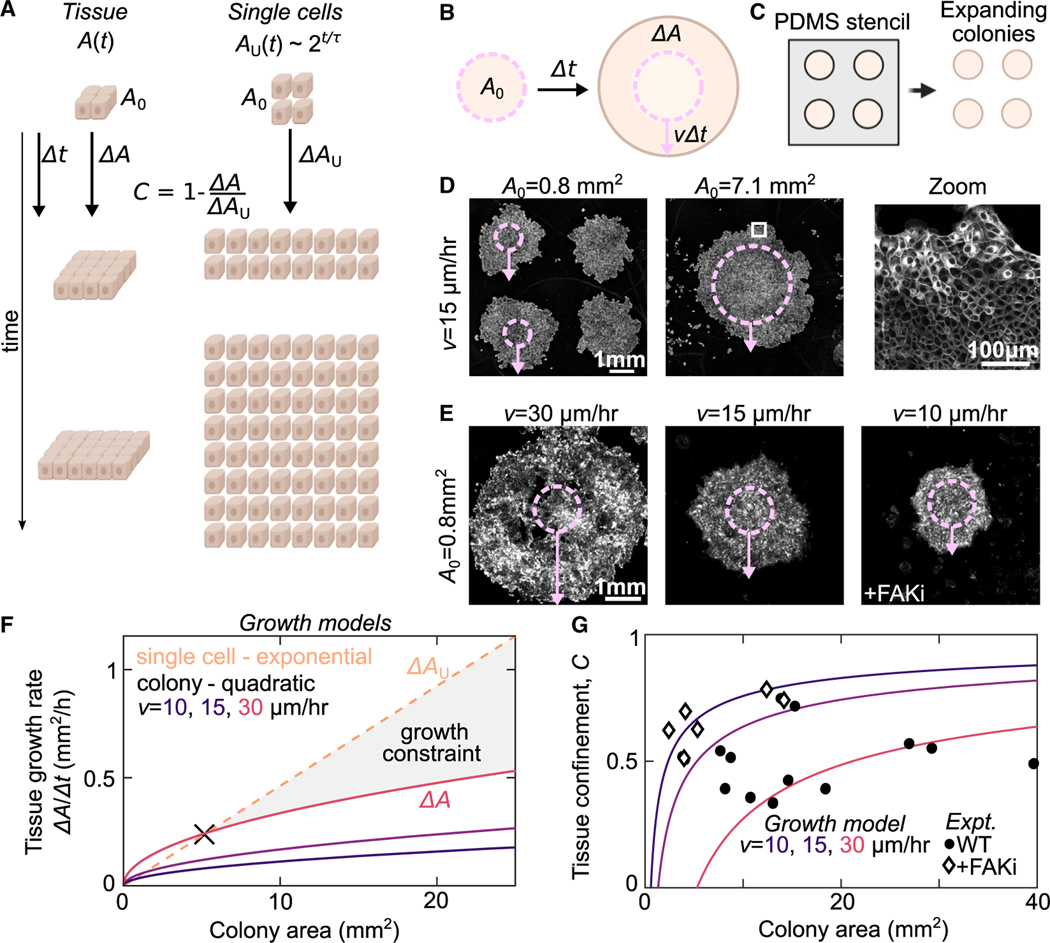
Figure 3. Tissue confinement quantifies how tissue-scale growth dynamics constrain cell growth.
(A) We consider the growth dynamics of a portion of multicellular tissue with time-dependent size with that of comprised of isolated cells of equal initial size, . The population of individual cells grows exponentially . The confinement, , is measured by comparing the relative growth rates.
(B) Schematic of expanding colony system. Cell colony of initial size expands at a constant radial velocity such that, for a given time interval , the radius increases by .
(C) Cells are initially seeded into a PDMS well of defined size . Then, this well is removed to initiate colony expansion.
(D) Cell Mask Orange staining in expanding MDCK colonies with two different initial sizes at h after removing the barrier. Overlay shows the initial size (dashed circle) and expansion (arrow). Arrows represent the average expansion radius across all colonies in the sample. Zoom in shows part of larger monolayer (white box).
(E) CellTrace Far Red staining of expanding MDCK colonies with variation in expansion rate from variation in WT dynamics and under FAK inhibition (500 nM PND-1186) Images are scaled differently for clarity and intensity is not comparable in these images.
(F) Quadratic growth models of colonies as a function of tissue area and expansion rate compared with a model of the exponential rate for single cells growing at the experimentally measured proliferation rate 15 h.
(G) Plot of the tissue confinement parameter, defined in the main text, calculated from comparing the model of colony growth rate to the model of single-cell growth rate. Curves show tissue confinement as a function of tissue area and expansion rate. Black points show confinement measurements from the experimentally determined area growth rate of expanding colonies at h (see STAR Methods). See also Figure S5.

