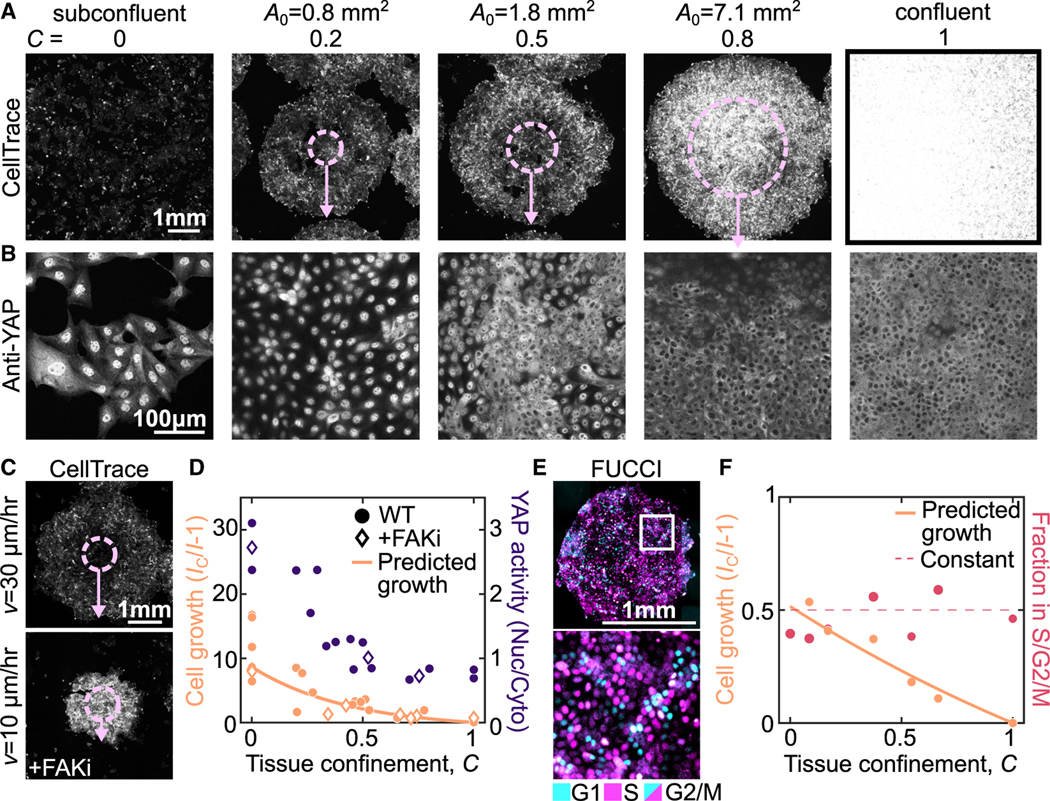
Figure 4. Tissue confinement determines cell growth rate and signaling.
(A and B) Images of Cell Trace (A) and YAP (B) at h in expanding colonies with initial size, , varying from 0.8 to 7.1 mm2, subconfluent colonies and confluent conditions. In (A), overlay shows initial colony size (dashed circle) and expansion (arrow). Note different scale bars in (A) and (B).
(C) CellTrace images of expanding monolayers with mm at h in the presence and absence of 500 nM PND1186 (+FAKi) to illustrate the effect of changes in .
(D) Quantification of cell growth and YAP signaling at varying tissue confinements with h across multiple experiments. Each data point is an average of multiple colonies from one experiment (see STAR Methods). YAP activity is determined by the nuclear-to-cytoplasmic ratio of anti-YAP intensity, quantified for >150 cells in each experiment. Growth is plotted against the time averaged confinement and YAP activity is plotted against the final confinement. Data are from 6 independent experiments (cell growth) and 3 independent experiments (YAP activity).
(E) MDCK FUCCI cells in expanding colony with mm2 and h.
(F) Quantification of cell growth and fraction of cells in the S/G2/M cell-cycle states as a function of the average tissue confinement. Each data point is quantified from >3 colonies in a single experiment with , 1.8, or 7.1 mm2 and h. Data are from 2 independent experiments. See also Figure S11.

