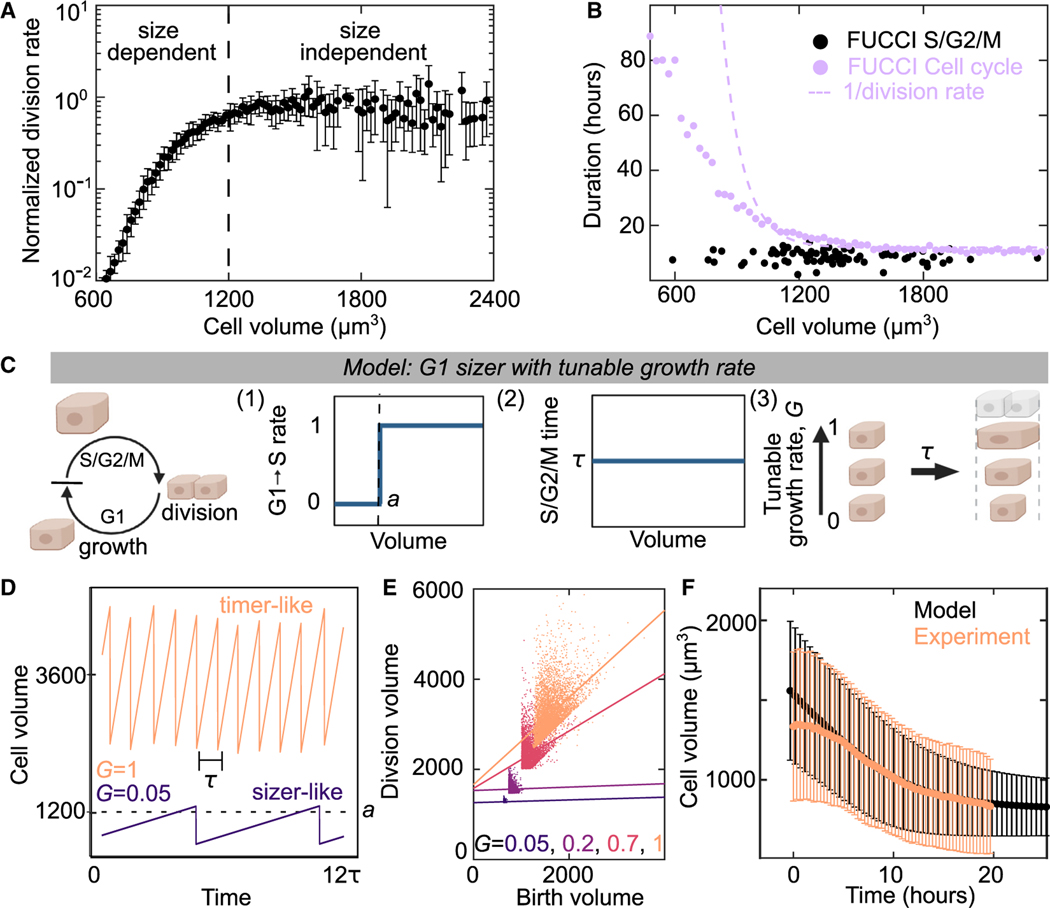
Figure 5. A G1 sizer arrests the cell cycle.
(A) Normalized cell-division rate as a function of cell volume in MDCK monolayers. Volume is calculated from cell areas multiplied by the average experimental height (see STAR Methods). Data are population averaged from 4 experimental replicates with >500 division events, error bar is SD of experimental replicates.
(B) Duration of cell cycle (violet) and S/G2/M (black) for MDCK cells as a function of cell size. Dotted violet line is a fit to the data in (A) to extract the cell-cycle duration. S/G2/M time are single-cell measurements from n = 82 trajectories for cell cycle. Cell-cycle time data (violet points) are population averaged FUCCI measurements from 50 fields of view containing >100 cells from 1 experiment (see STAR Methods).
(C) Schematic of G1 sizer model: cells are simulated to grow at a constant rate, transition between cell-cycle states and divide. (1) Cells transition rapidly from G1 to S only when above a critical volume a, (2) cells have a set S/G2/M duration equal to time t that is independent of size, and (3) cells have a variable growth rate, G, independent of the cell cycle.
(D) G1 Sizer models results of cell volume as function of time for two growth rates (G = 1 and G = 0.05).
(E) G1 Sizer model results of cell volume at division as a function of birth volume for G = 0.05, 2, 0.7, and 1. Dotted lines show a linear fit to the data (slope = 0, 0, 0.4, and 1). Each condition contains 400 simulation trajectories.
(F) Cell volume as a function of time for experimental data from Figure 2D (peach) and for G1 sizer model results (black). The onset of confluence occurs at for experiments. For simulations, this is models with a growth rate quench from 1 to 0 at h. Data is mean cell volume, error bars are the standard deviation. Each time point in the experiment is the average of >10,000 cells from 30 fields of view. Each simulation time point is an average of >15,000 cells from 35 simulations. See also Figures S6–S8.

