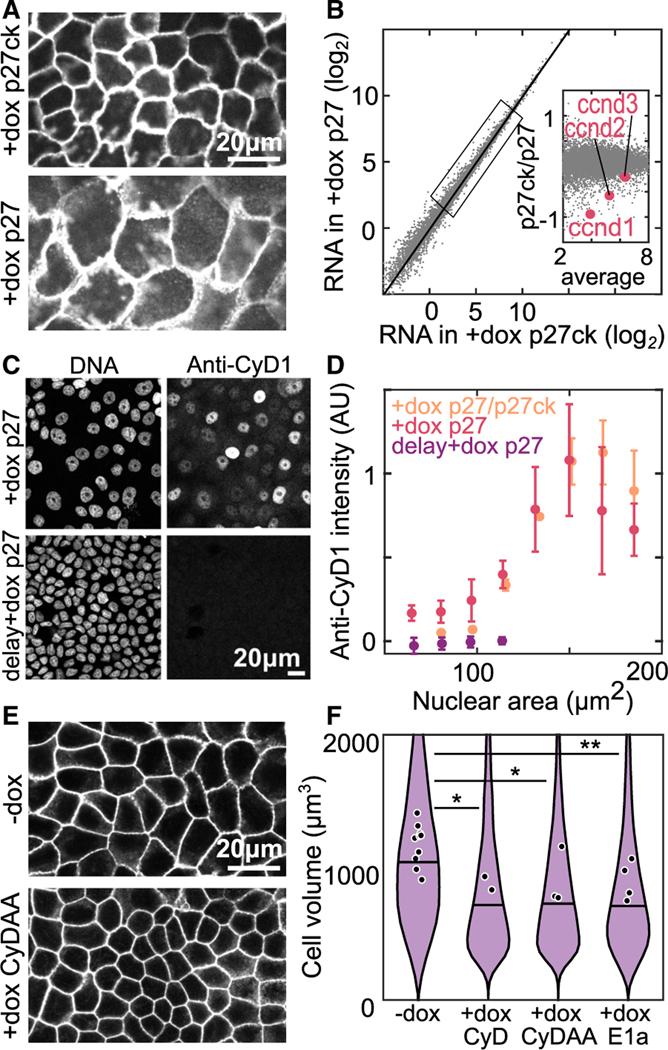
Figure 6. Low cyclin D causes cell-cycle arrest in small cells.
(A) Cell membranes of Tet-On p27 and Tet-On p27ck MDCK cells in ME + 4 days; dox added at h.
(B) RNA sequencing data from monolayers prepared in (A). Data are averaged transcripts per million from 3 experimental replicates. Inset: zoom in of genes in indicated box, cyclin D genes expression levels are highlighted in red.
(C) DNA staining and anti-cyclin D1 (cyD1) immunofluorescence staining in MDCK monolayers at ME + 3 days. Dox is added at either (+dox p27) or at days (delay +dox p27).
(D) Quantification of anti-cyD1 intensity from immunostaining data as a function of nuclear area. Intensity is normalized in each experiment to a maximum value of 1. P27/p27ck are monolayers with a mixture of Tet-On p27 and Tet-On p27ck cells. .
(E) Labeled cell membranes in Tet-On cyclin D1 T286A T288A (CyDAA) MDCK monolayers at ME + 3 days without dox (−dox) or with dox added at (+dox CyDAA).
(F) Cell volume measured in resuspended Tet-On cyclin D1, Tet-On cyclin D T286A T288A, and Tet-On 12sE1a cells at ME + 3 days without dox (−dox) or with dox added at (+dox CyD, +dox CyDAA, +dox E1a). (*p < 0.05, **p < 0.01 from comparison of experimental means). See also Figures S9 and S10.

