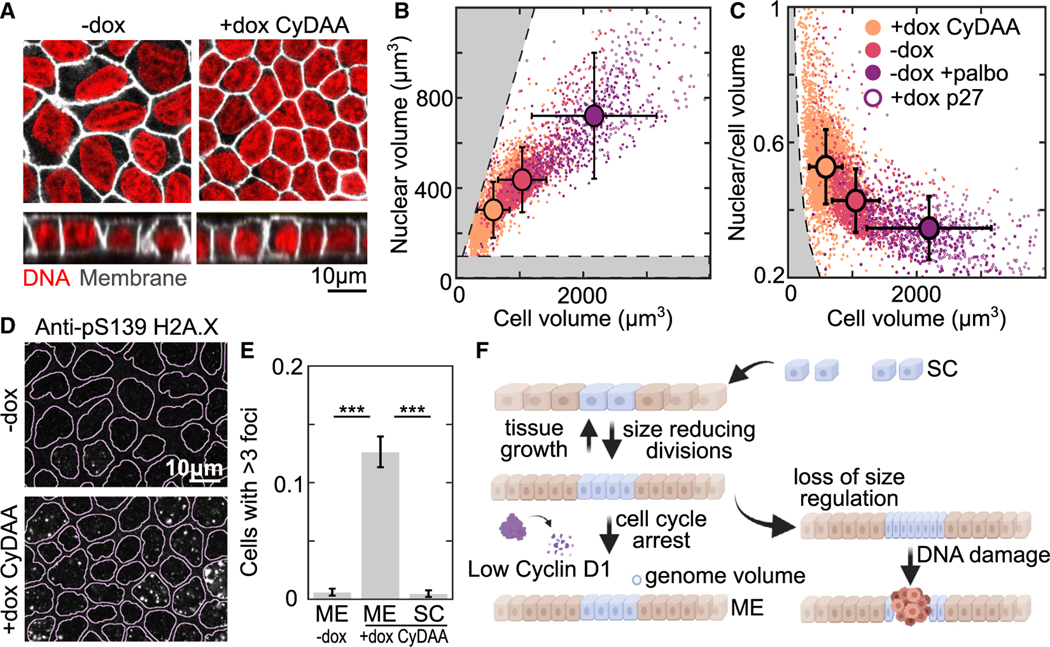
Figure 7. Cells arrest near a minimum size set by genome volume.
(A) Nuclear (red, Spy650-DNA) and membrane (white, Stargazin-halotag) staining of Tet-On cyclin D1 T286A T288A MDCK cell monolayers at ME + 3 days without dox (−dox) or with dox added at (+dox CyDAA).
(B and C) Plots comparing nuclear volume and cell volume measured from 3D imaging in conditions from (A) (−dox, +dox CyDAA) or in cell-cycle-inhibited conditions (−dox +palbo) or Tet-On p27 cells (+dox p27). +palbo is 1 μM palbociclib. (B) shows the correlation between the cell and nuclear volumes, while (C) show the ratio of these volumes. Gray regions indicate when nuclear volume is larger than cell volume (B, top left) or when chromatin density is higher than chromosomes (B, bottom; C, left). Error bars show SD of data .
(D) Monolayers in the same conditions as (A) immunostained for pS139 H2A.X (yH2A.X). Lines overlayed on images show nuclear segmentation from DNA staining.
(E) Quantification of pS139 H2A.X foci from conditions in (D). Bar is the mean fraction of cells with >3 foci between 3 experimental replicates. Error bar is SD of experiment means .
(F) schematic summarizing cell-volume regulation in epithelium. (***p < 0.001 from comparison of experimental means).

