
Figure 2. Sensory-evoked activity of VIP interneurons.
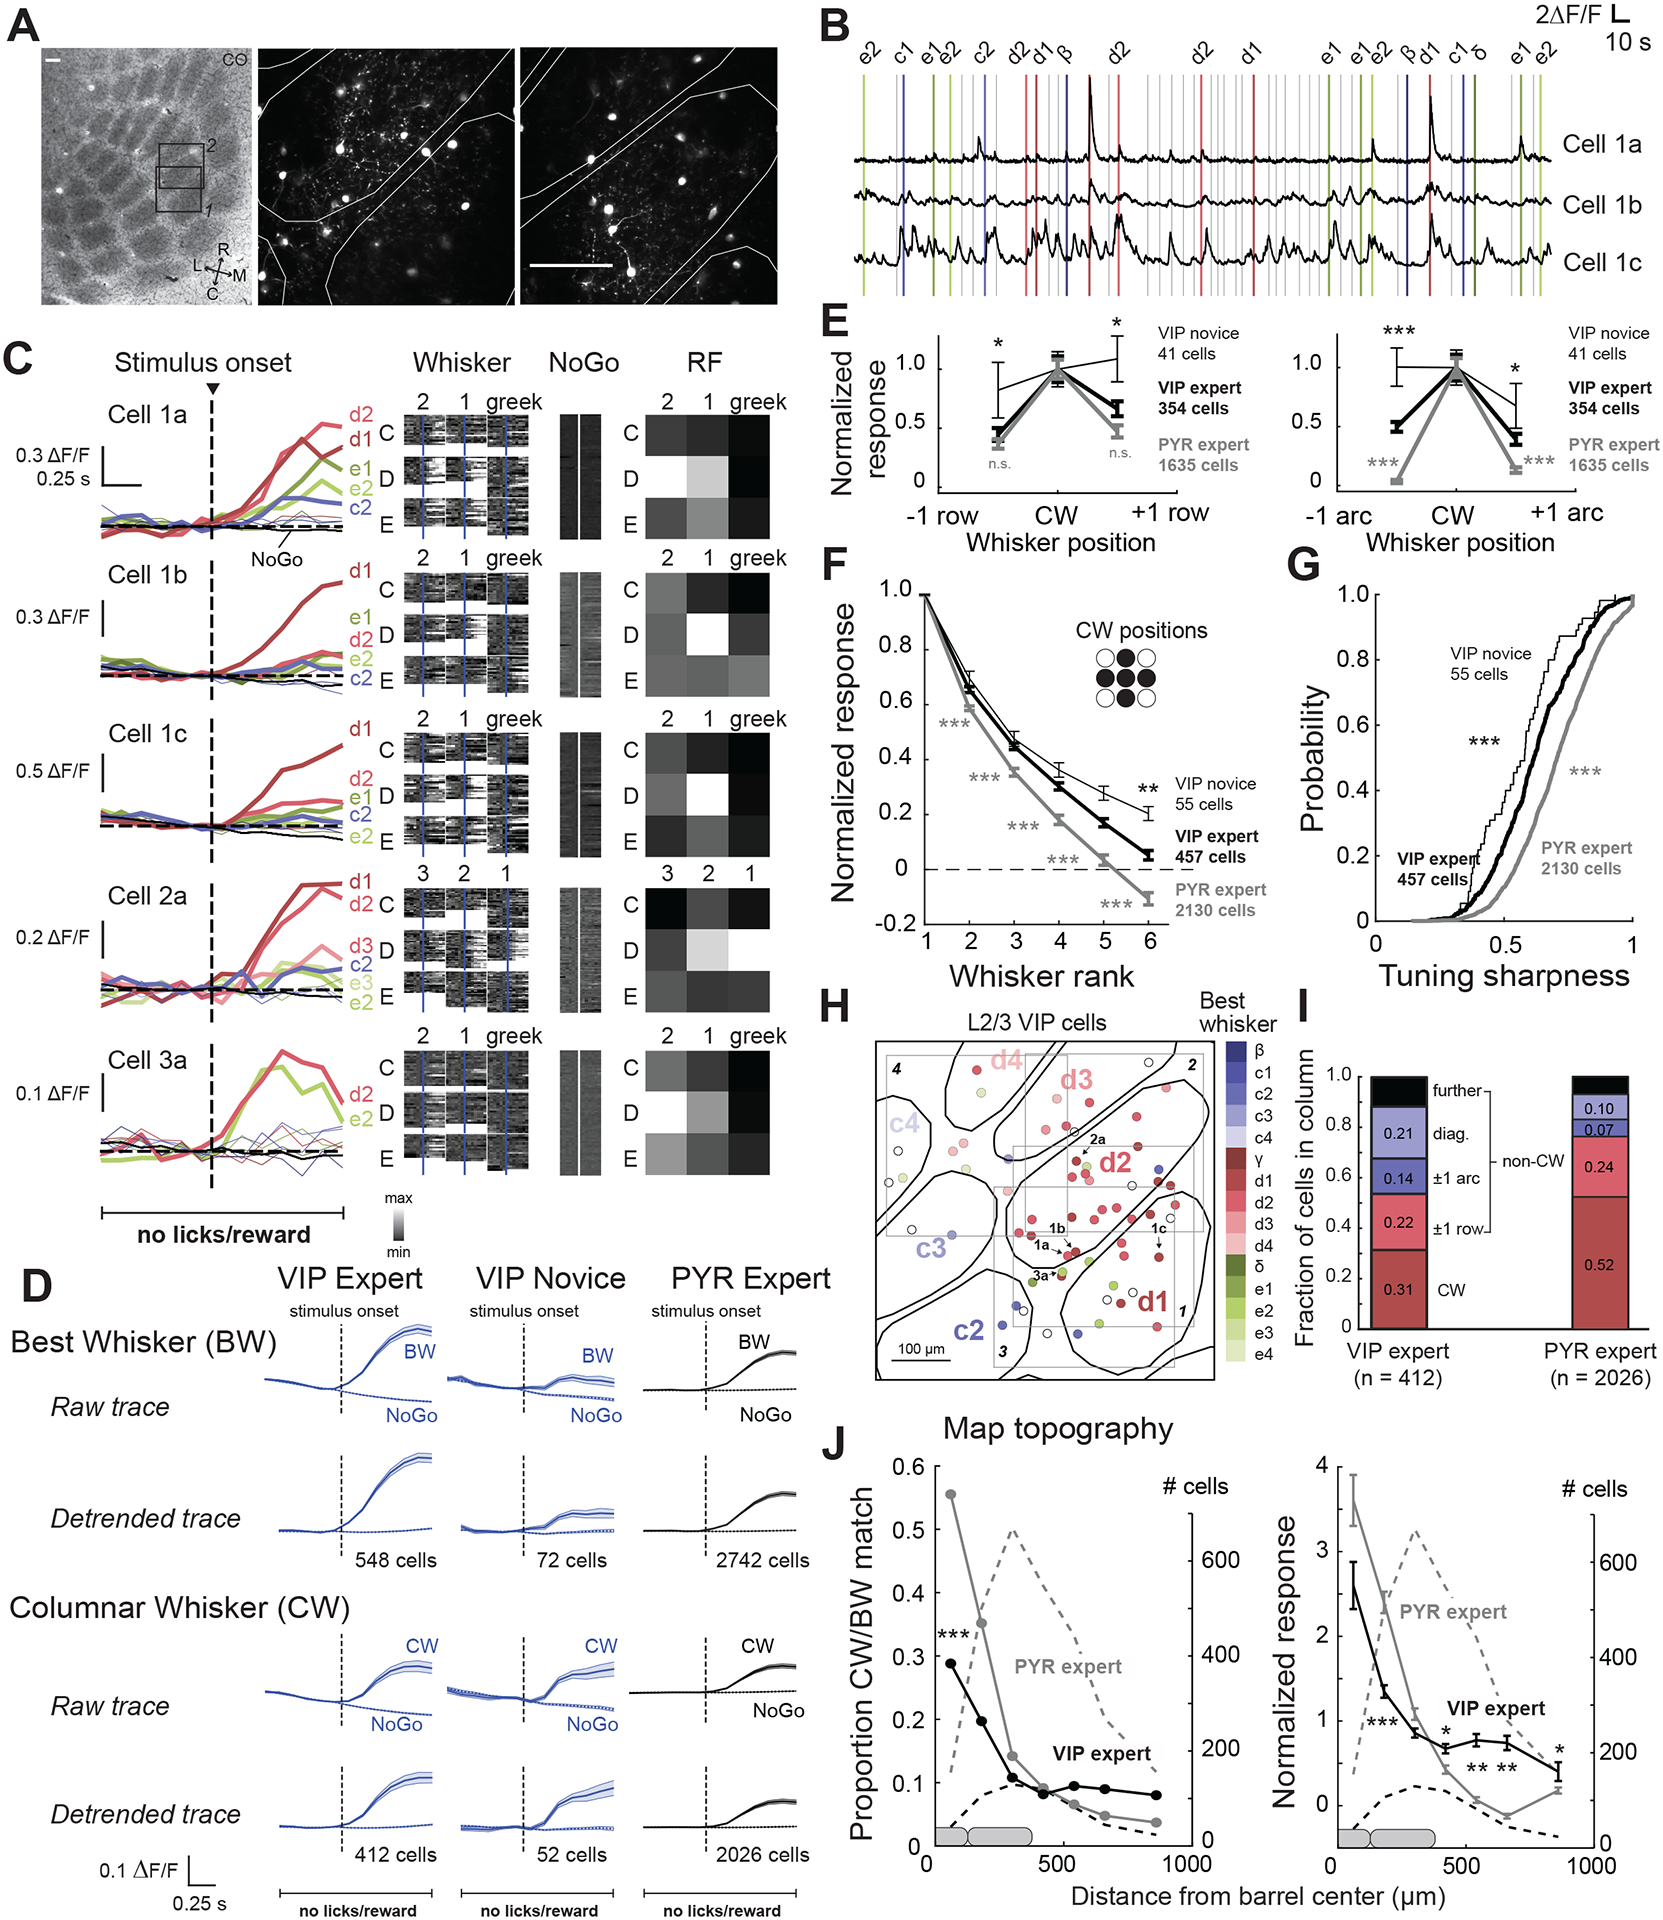
A. Two L2/3 imaging fields from a VIP-Cre; Ai162D mouse, localized relative to CO-stained barrels in L4. White contours are column boundaries. B. ΔF/F traces from 3 VIP cells from one field. Bars show time of whisker deflections on Go trials (color-coded by whisker identity) or NoGo trials (gray bars), which contained dummy piezo movement but no whisker deflection. C. Whisker receptive fields for 5 VIP cells, including those in (B). Left, median ΔF/F trace for each whisker (color) and dummy (NoGo) stimulus (gray). Middle, ΔF/F traces for each trial for each stimulus type. Right, Normalized response magnitude across whiskers. D. Mean whisker stimulus-aligned ΔF/F trace for all VIP and PYR cells with significant whisker responses. For columnar whisker responses, cells located in septa were excluded. Detrended traces were linearly detrended by prestimulus baseline (0.666 s). Error bars show mean±SEM. E. Mean responses to CW and same-row or same-arc surround whisker (SWs), for all whisker-responsive cells for which the CW and at least 5 SWs were tested. F. Mean rank-ordered receptive field for all whisker-responsive cells. Same data as (E). G. Distribution of tuning sharpness, calculated as (RBW−RW)/(RBW + RW), where RBW = mean ΔF/F to BW, and RW = mean ΔF/F for all other whiskers. Same data as (E) and (F). H. VIP cells from 4 imaging fields in one mouse. Color indicates best whisker, open circles are non-whisker responsive. Arrows, example cells from (B) & (C). I. Identity of best whiskers for cells located within a barrel column (septal cells excluded). J. Proportion of cells tuned to a reference whisker, as a function of distance from the reference whisker column. Dashed lines, cell count in each spatial bin. K. Same, but showing mean response to a reference whisker. See also Figure S1 and Table S1.