
Figure Appendix A.2:
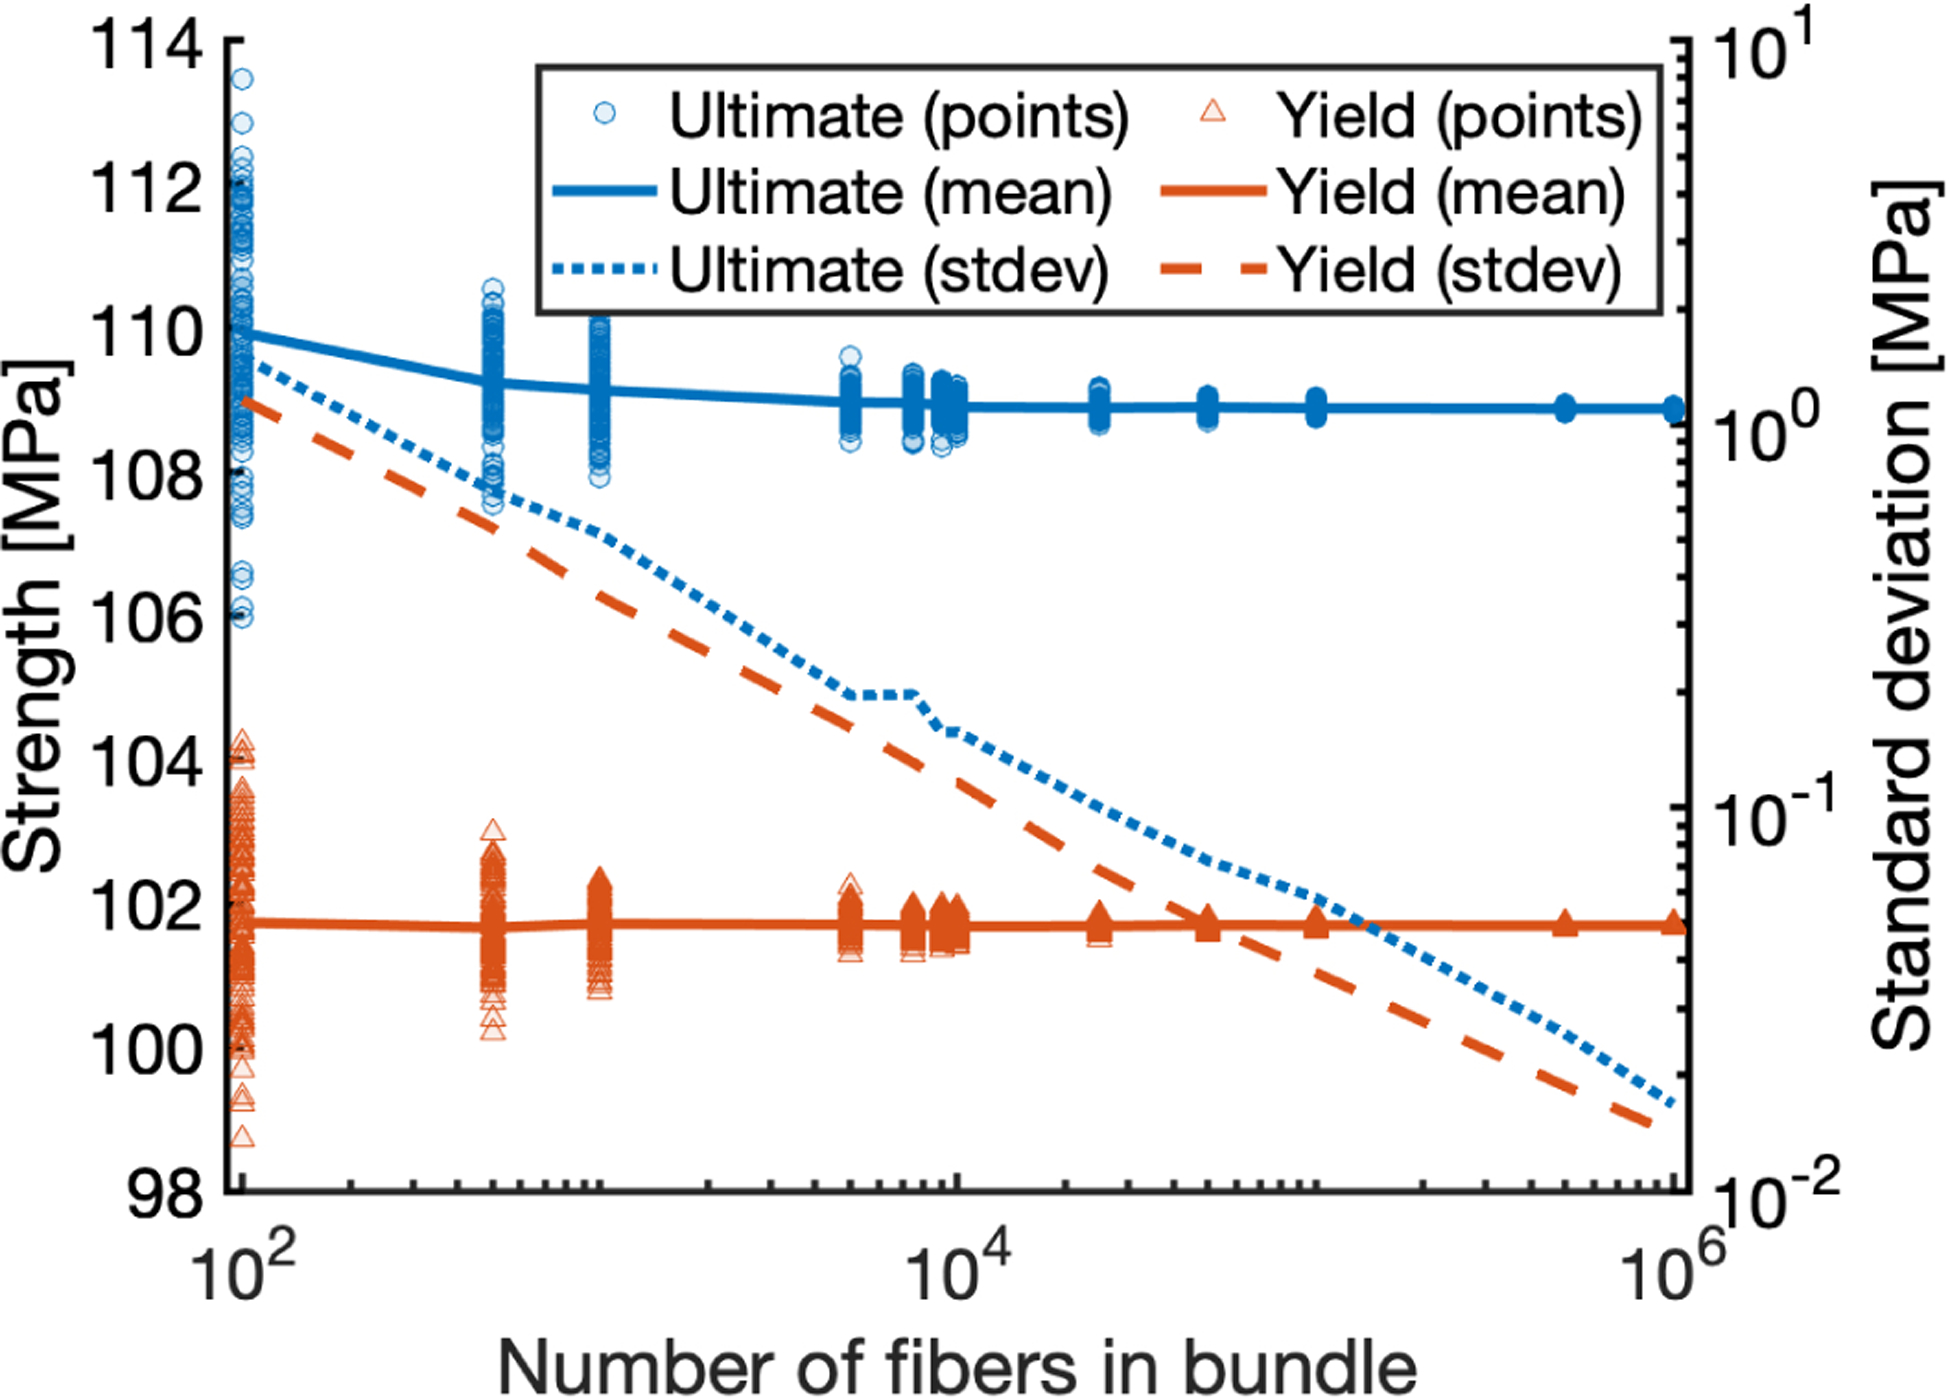
Predicted strength and its standard deviation vs. number of fibers in the bundle. Convergence of ultimate stress (upper line, blue) and yield stress (lower line, red) resulting from randomly sampling model inputs for 100 simulations for each trial number of fibers.