
Figure 4:
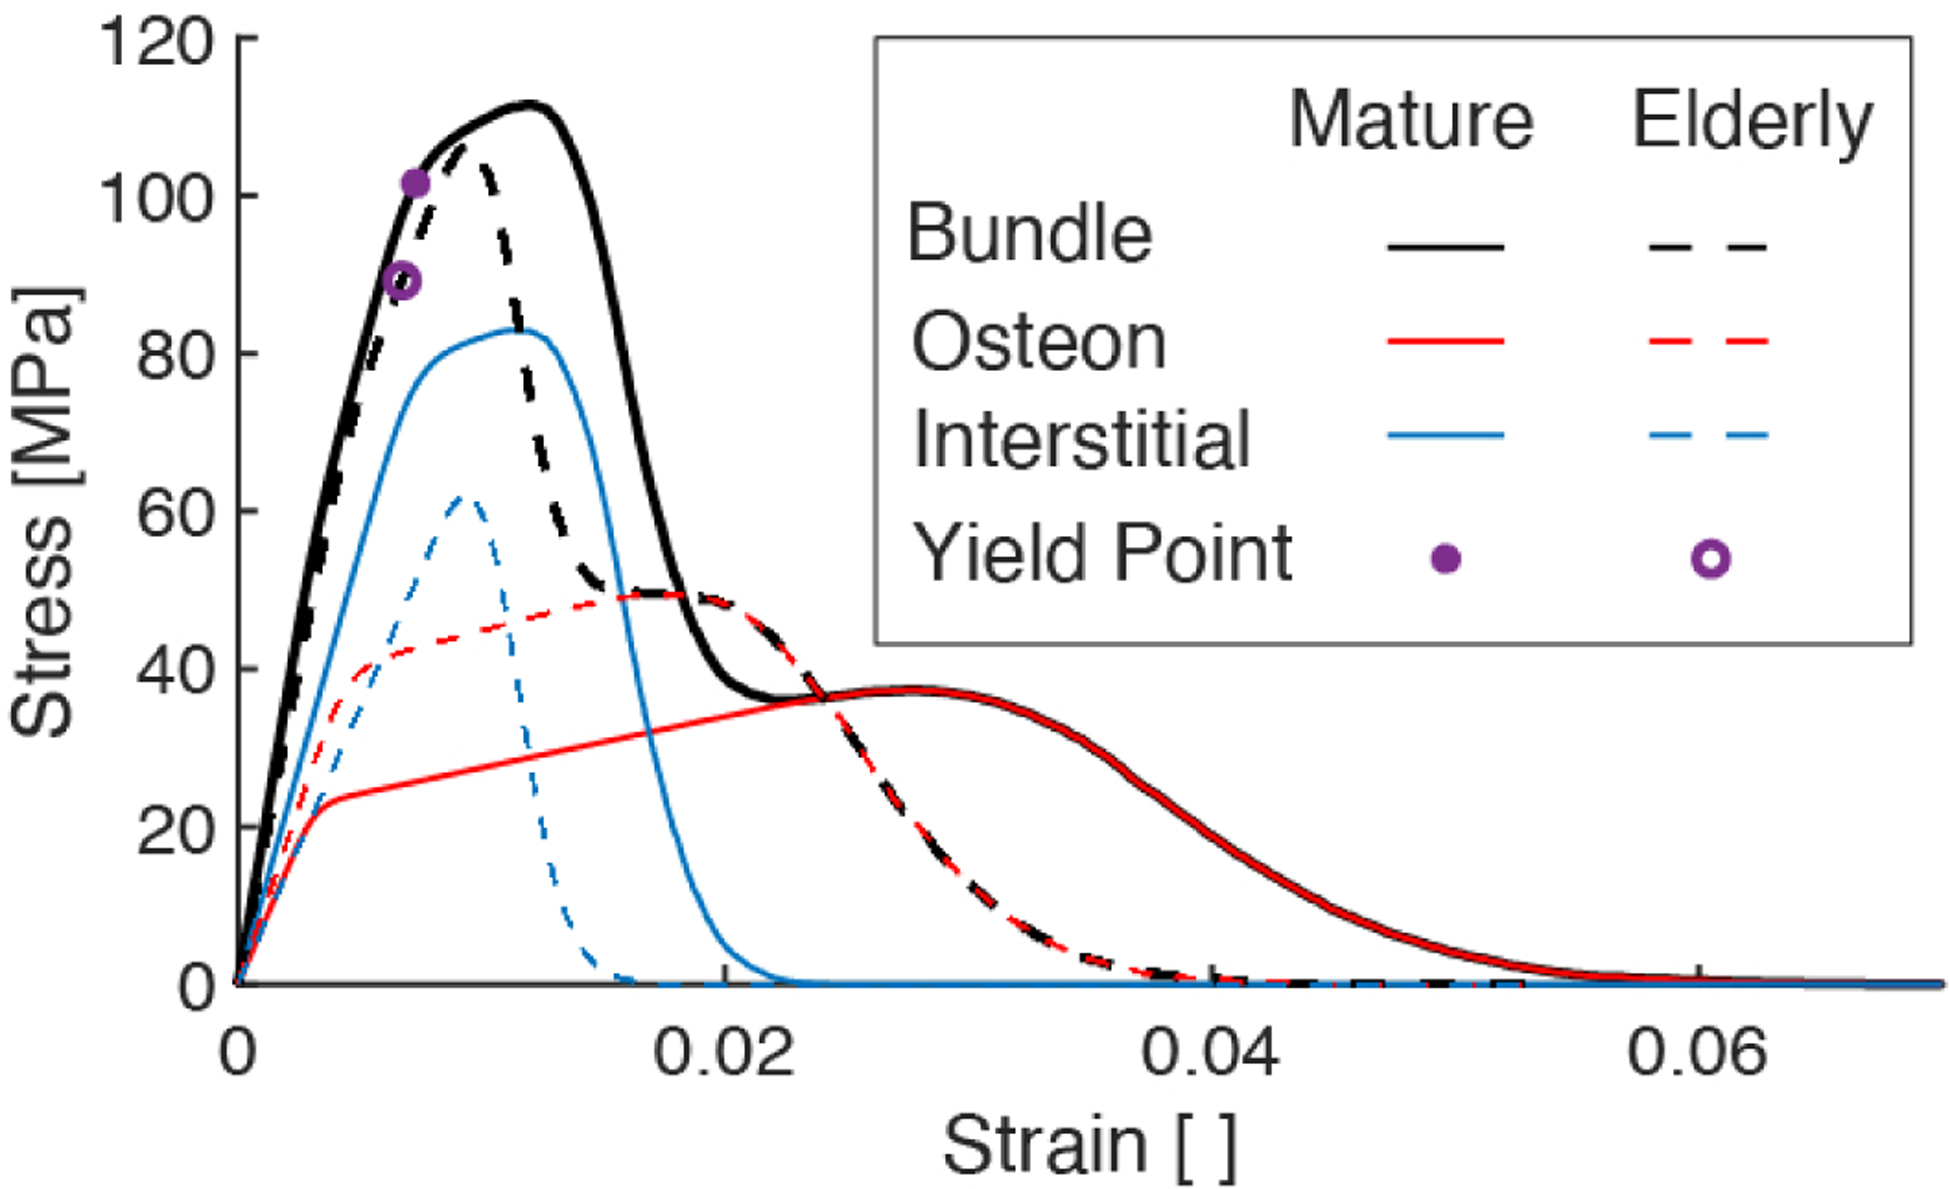
Stress-strain curves of elastic-plastic fiber bundle model comparing the mechanical behavior of the mature bone and elderly bone model cases. The blue (and red, respectively) curves show the partial stress borne by the interstitial (and osteon, respectively) fibers. The sum of the partial stresses give the total stress (black curves).