
Figure 5:
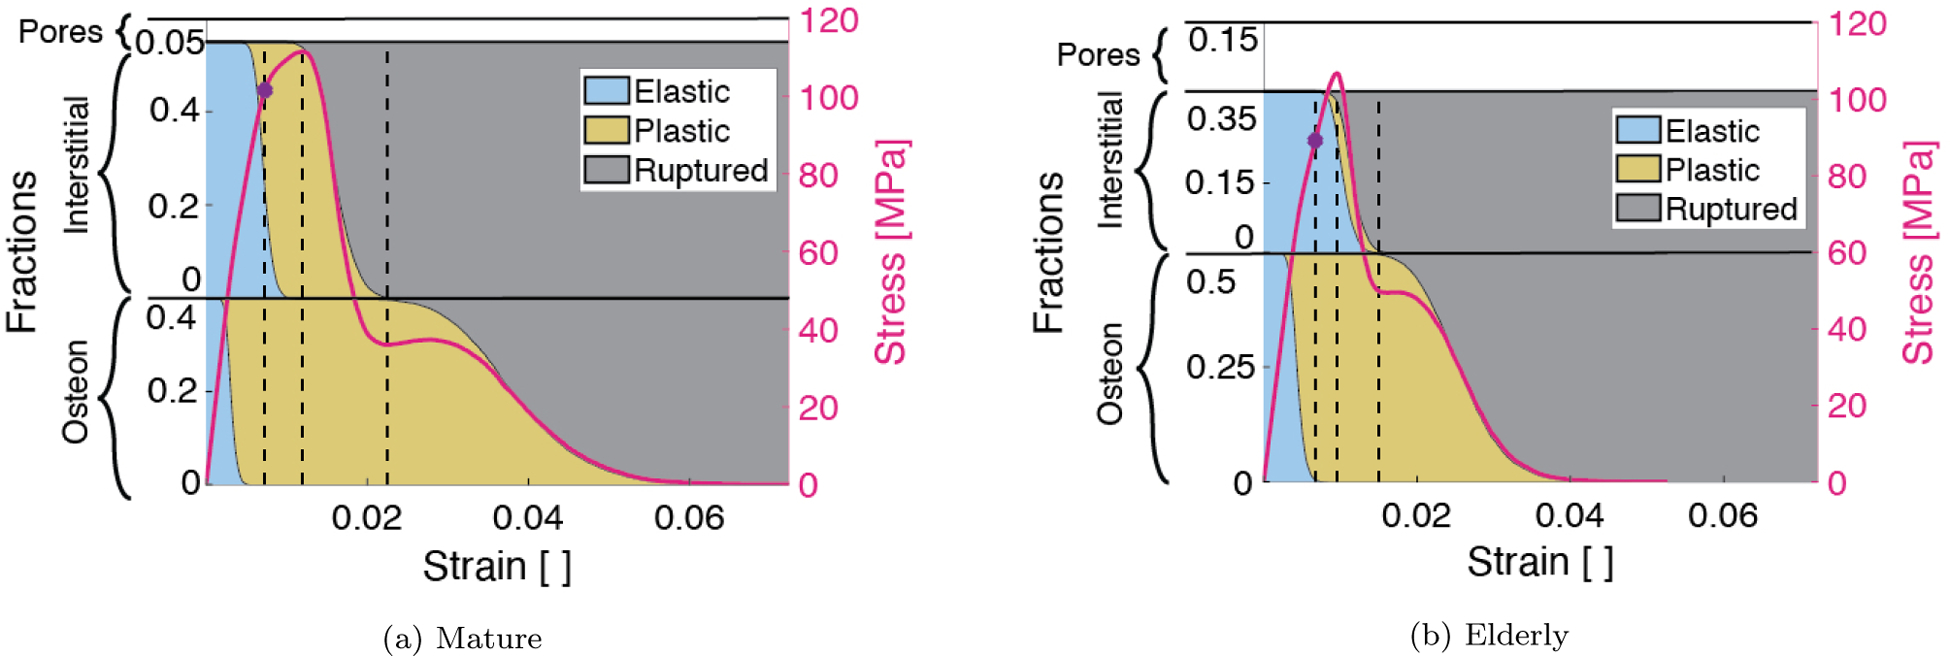
Fractions of osteon (bottom) and interstitial (top) fibers separated into elastic (blue), yielded (yellow), and ruptured (gray) regimes at each bundle deformation step. The stress-strain curve corresponding to each case (mature on the left and elderly on the right) is overlayed on the area fractions. Dotted black lines indicate the fraction of fibers pertaining to key regimes of the bundle mechanical behavior at the yield strain, ultimate strain, and the strain at which all interstitial fibers have ruptured.