
Figure 6:
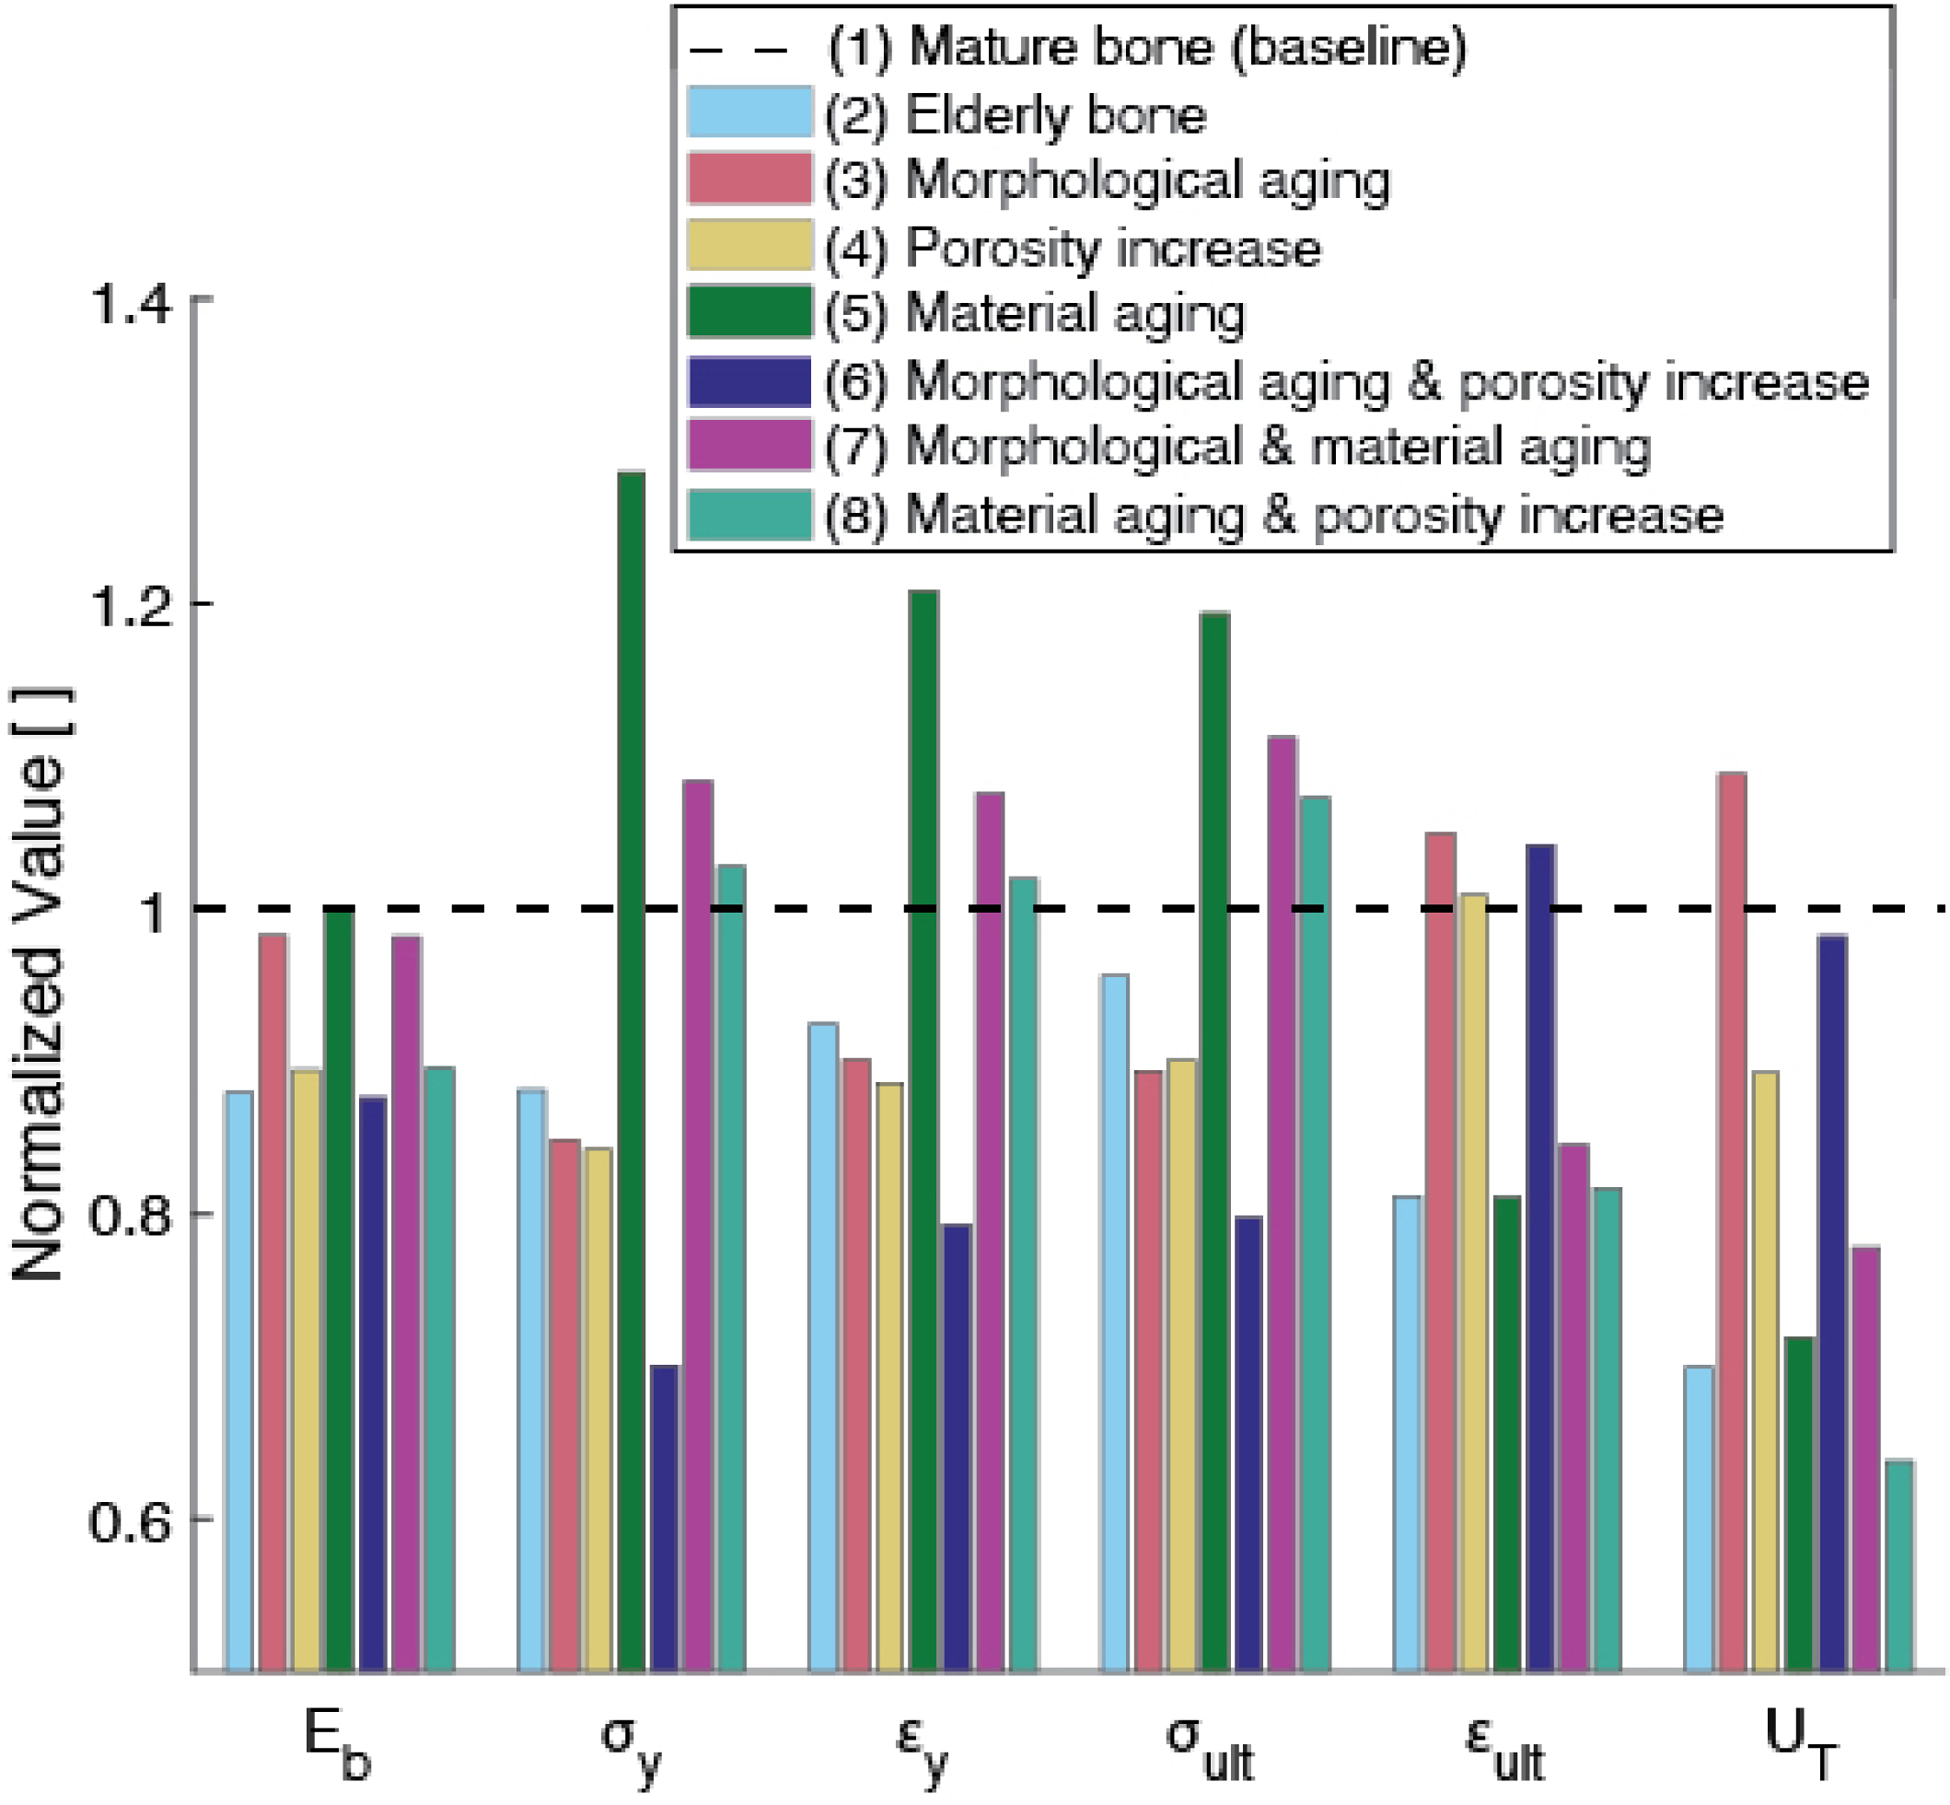
Normalized model outputs for various cases (as listed in Table 2). Case (2) (light blue) corresponds to the prediction for elderly bone, which contains all three aging-related changes to the inputs: morphological (increased volume fraction of osteons with respect to interstitial fraction), increased porosity, and changes in material properties. Cases (3, 4, 5) (rose, yellow, green) correspond to an individual aging-related change, while Cases (6, 7, 8) (indigo, magenta, teal) correspond to a combination of two (but not all) changes in input parameters. Referring to, for example, the group of bars related to toughness (on the right, labeled ‘ ‘), we can see that changing morphology alone causes toughness to increase by less than 10%. Aging porosity alone causes toughness to decrease from the baseline case by roughly 10%.