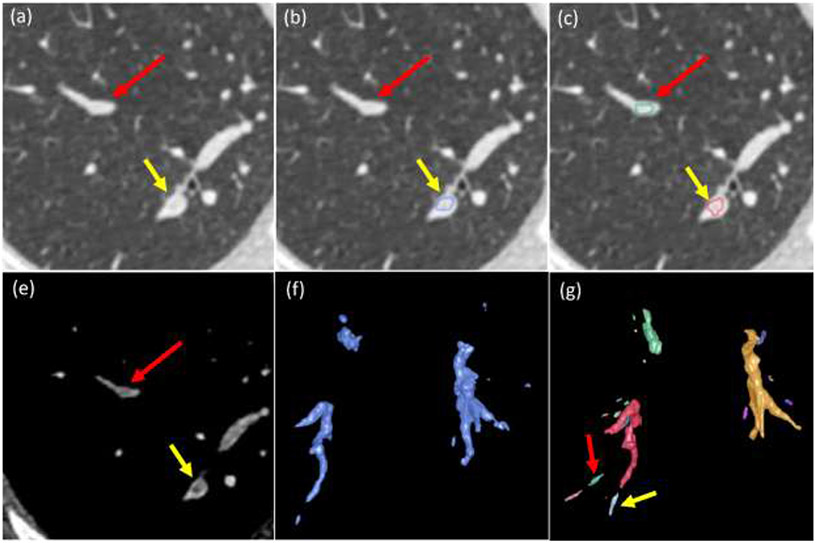
Fig. 6.
False positive detections. (a) and (e) original CT images at different window/level settings with false positive (red arrow) and true positive (yellow arrow), (b) overlay of the radiologist’s manual outline, (c) overlay of the detection and segmentation by the CNN model, (f) 3-D visualization of the manually outlined PEs, and (g) 3-D visualization of the PE regions detected by the CNN model.

