
Figure 3. A population of Pf neurons represent contraversive velocity.
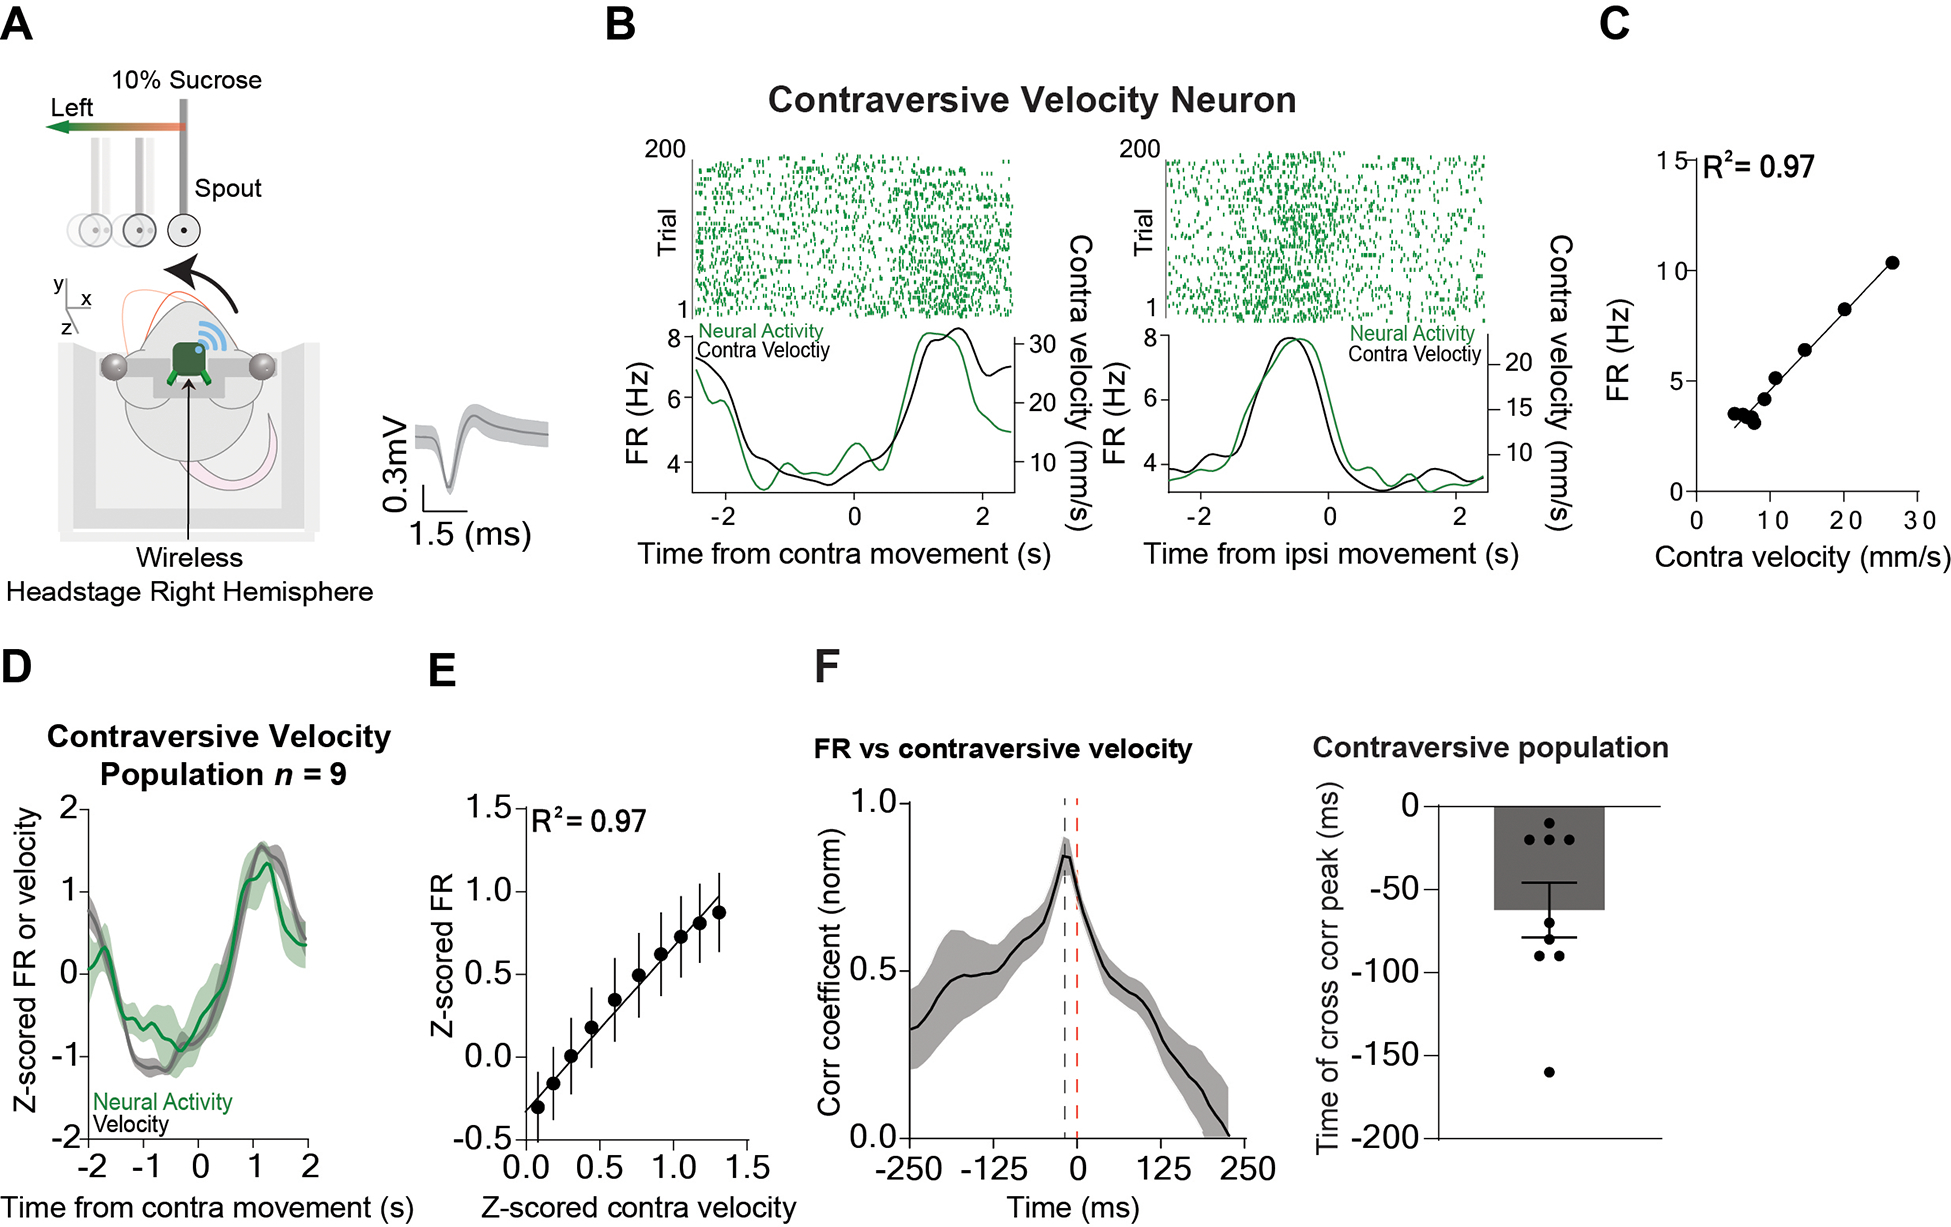
A) Illustration of a mouse tracking the reward in the direction contraversive to the electrode implant. The average wave form of the contraversive population. B) Representative Pf contraversive velocity neuron showing a high positive correlation with ipsiversive velocity. Left: Peri-event raster plot of a representative neuron aligned to the target moving contraversive (0 to 2 seconds) and the corresponding velocity. Right: Peri-event raster plot of the same Pf neuron and the corresponding velocity when the target was moving ipsiversive (0 to 2 seconds). C) There was a high positive correlation between the contraversive velocity and the firing rate of the representative neuron. Correlation (p < 0.0001). D) The population of contraversive velocity neurons (n = 9) increased their firing rate during contraversive movement and decreased during ipsiversive movement. E) There was a high positive correlation between the firing rate of the contraversive velocity population and contraversive velocity. Correlation (p < 0.0001). F) Cross-correlation between activity of contraversive velocity neurons and contraversive velocity shows that neural activity preceded the behavior. Error bars indicate mean ± SEM. See also Figures S1–S2.