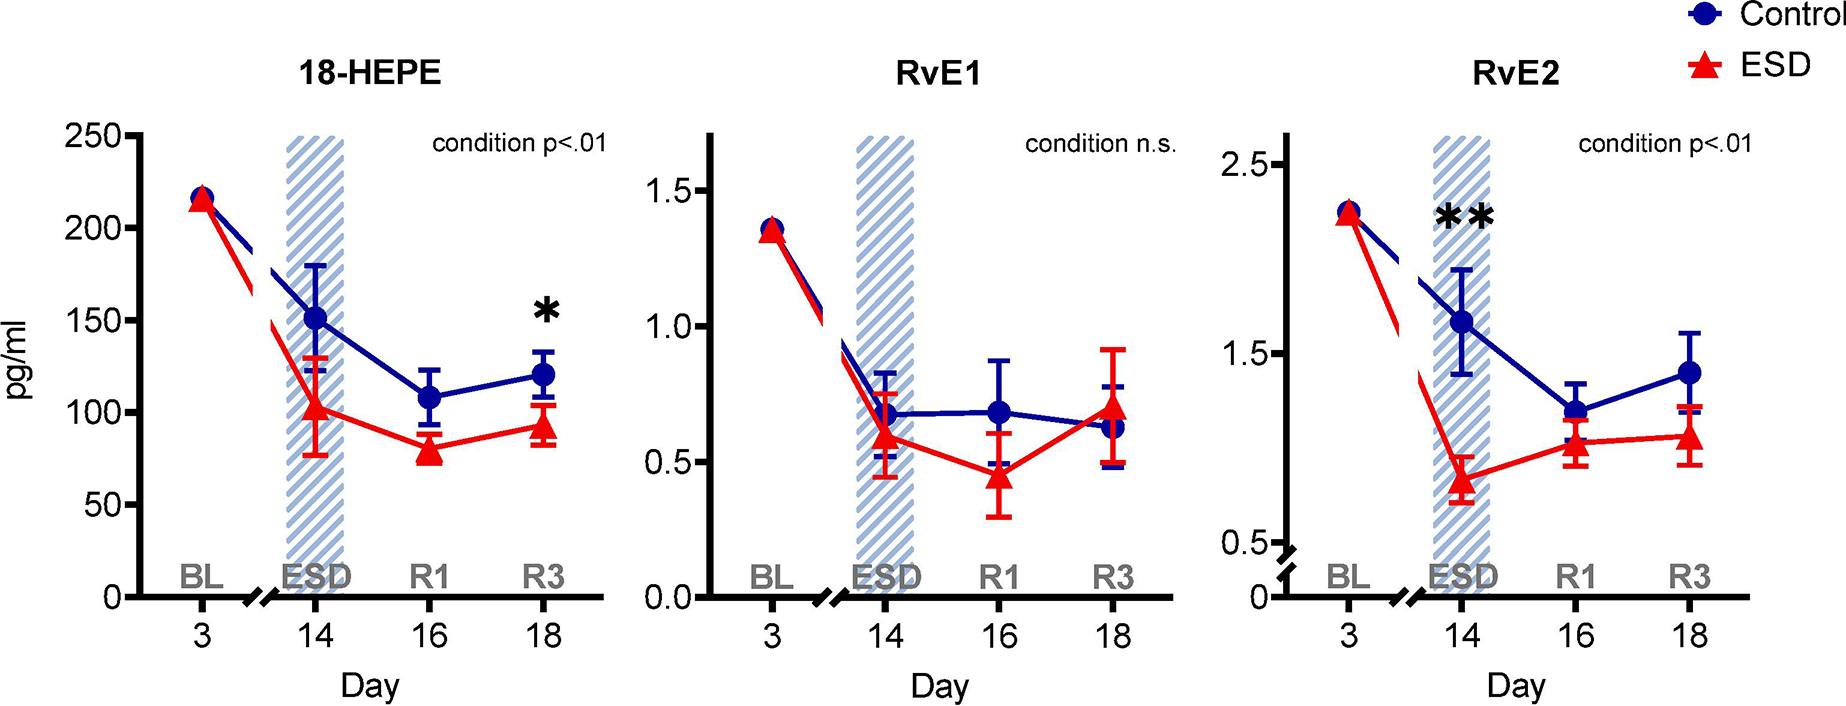
Fig. 3. The effect of experimental sleep disturbances (ESD) on E-series resolvins and their precursor in healthy humans.

The graphs show results of GLMM analyses (EMM ± SEM) for plasma concentrations in pg/ml of the precursor 18-hydroxyeicosapentaenoic acid (18-HEPE) and the E-series resolvins RvE1 and RvE2. Shaded area indicates ESD. Red triangles indicate ESD condition (n = 22), blue dots indicate control condition (n = 23). Blood samples were collected at baseline (day 3 = BL), during the 3rd ESD cycle (day 14 = ESD), after 1 night of recovery sleep (day 16 = R1), and after 3 nights of recovery sleep (day 18 = R3). Detailed model results can be found in Table S6 (n.s. = not significant). Asterisks indicate results of pairwise comparisons between conditions: **p<.01, *p<.05. N = 24 (12F/12M) participants in total, refer to Table 1 for details.
