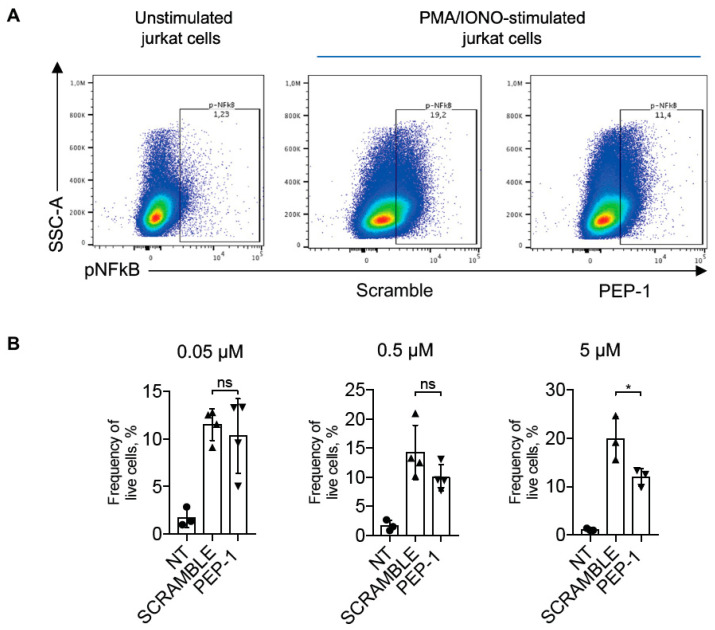
Figure 3.
PEP-1 decreases pNF-κB/p65 activation in Jurkat cells. Representative dot plots of flow cytometry analysis of p-NF-κB/p65 in Jurkat cells stimulated or not with PMA and ionomycin for 15 min (A). Numbers within quadrants represent the frequency of the gated population of positive pNF-κB cells treated with scramble or PEP-1 peptide (5 μM), compared to the frequency of positive pNF-κB unstimulated Jurkat cells. After that, graphs represent the frequency of pNF-κB+ live Jurkat cells treated with different doses of PEP-1 at the concentration indicated in the above graphs (B). Graphs represent the mean of at least three independent experiments ± SD. * p < 0.05. p-values were calculated using the unpaired Student’s t-test. ns: non-significant.

