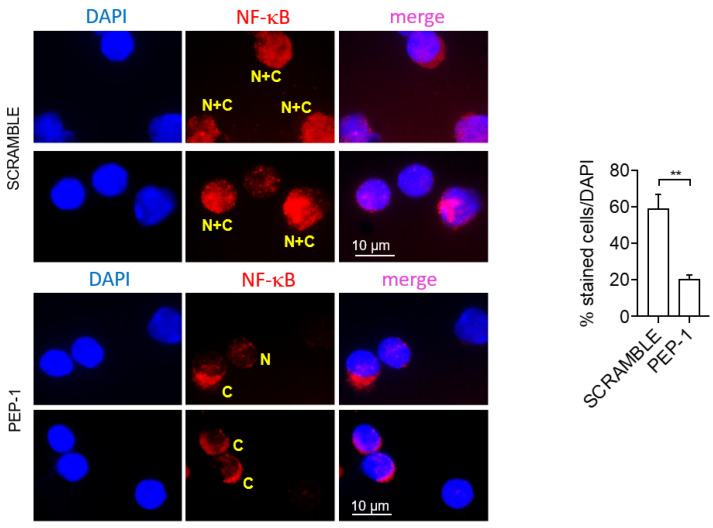
Figure 8.
PEP 1 reduces NF-κB nuclear translocation in leukocytes infiltrating the colon LP of IL-10KO mice. Representative immunofluorescence pictures showing pNF-κB/p65 positive cells of isolated colon LP cells from IL-10KO mice; quantification of NF-κB nuclear translocation was calculated by measuring the NF-kB localization to the cytoplasmic region and normalized by counting the total number of cells stained with DAPI. “N + C” (yellow): NF-κB staining in both the nucleus and cytoplasm; “C” (yellow): NF-κB staining in the cytoplasm; “N” (yellow): NF-κB staining in the nucleus. Graph sideways: cell count by ImageJ software of cytoplasmic NF-κB positive cells compared to all DAPI positive cells (representing the whole number of cells present in the slides analyzed). The graph represents mean ± SD. ** p < 0.005. p-values were calculated using the unpaired Student’s t-test. (n = 8/group).

