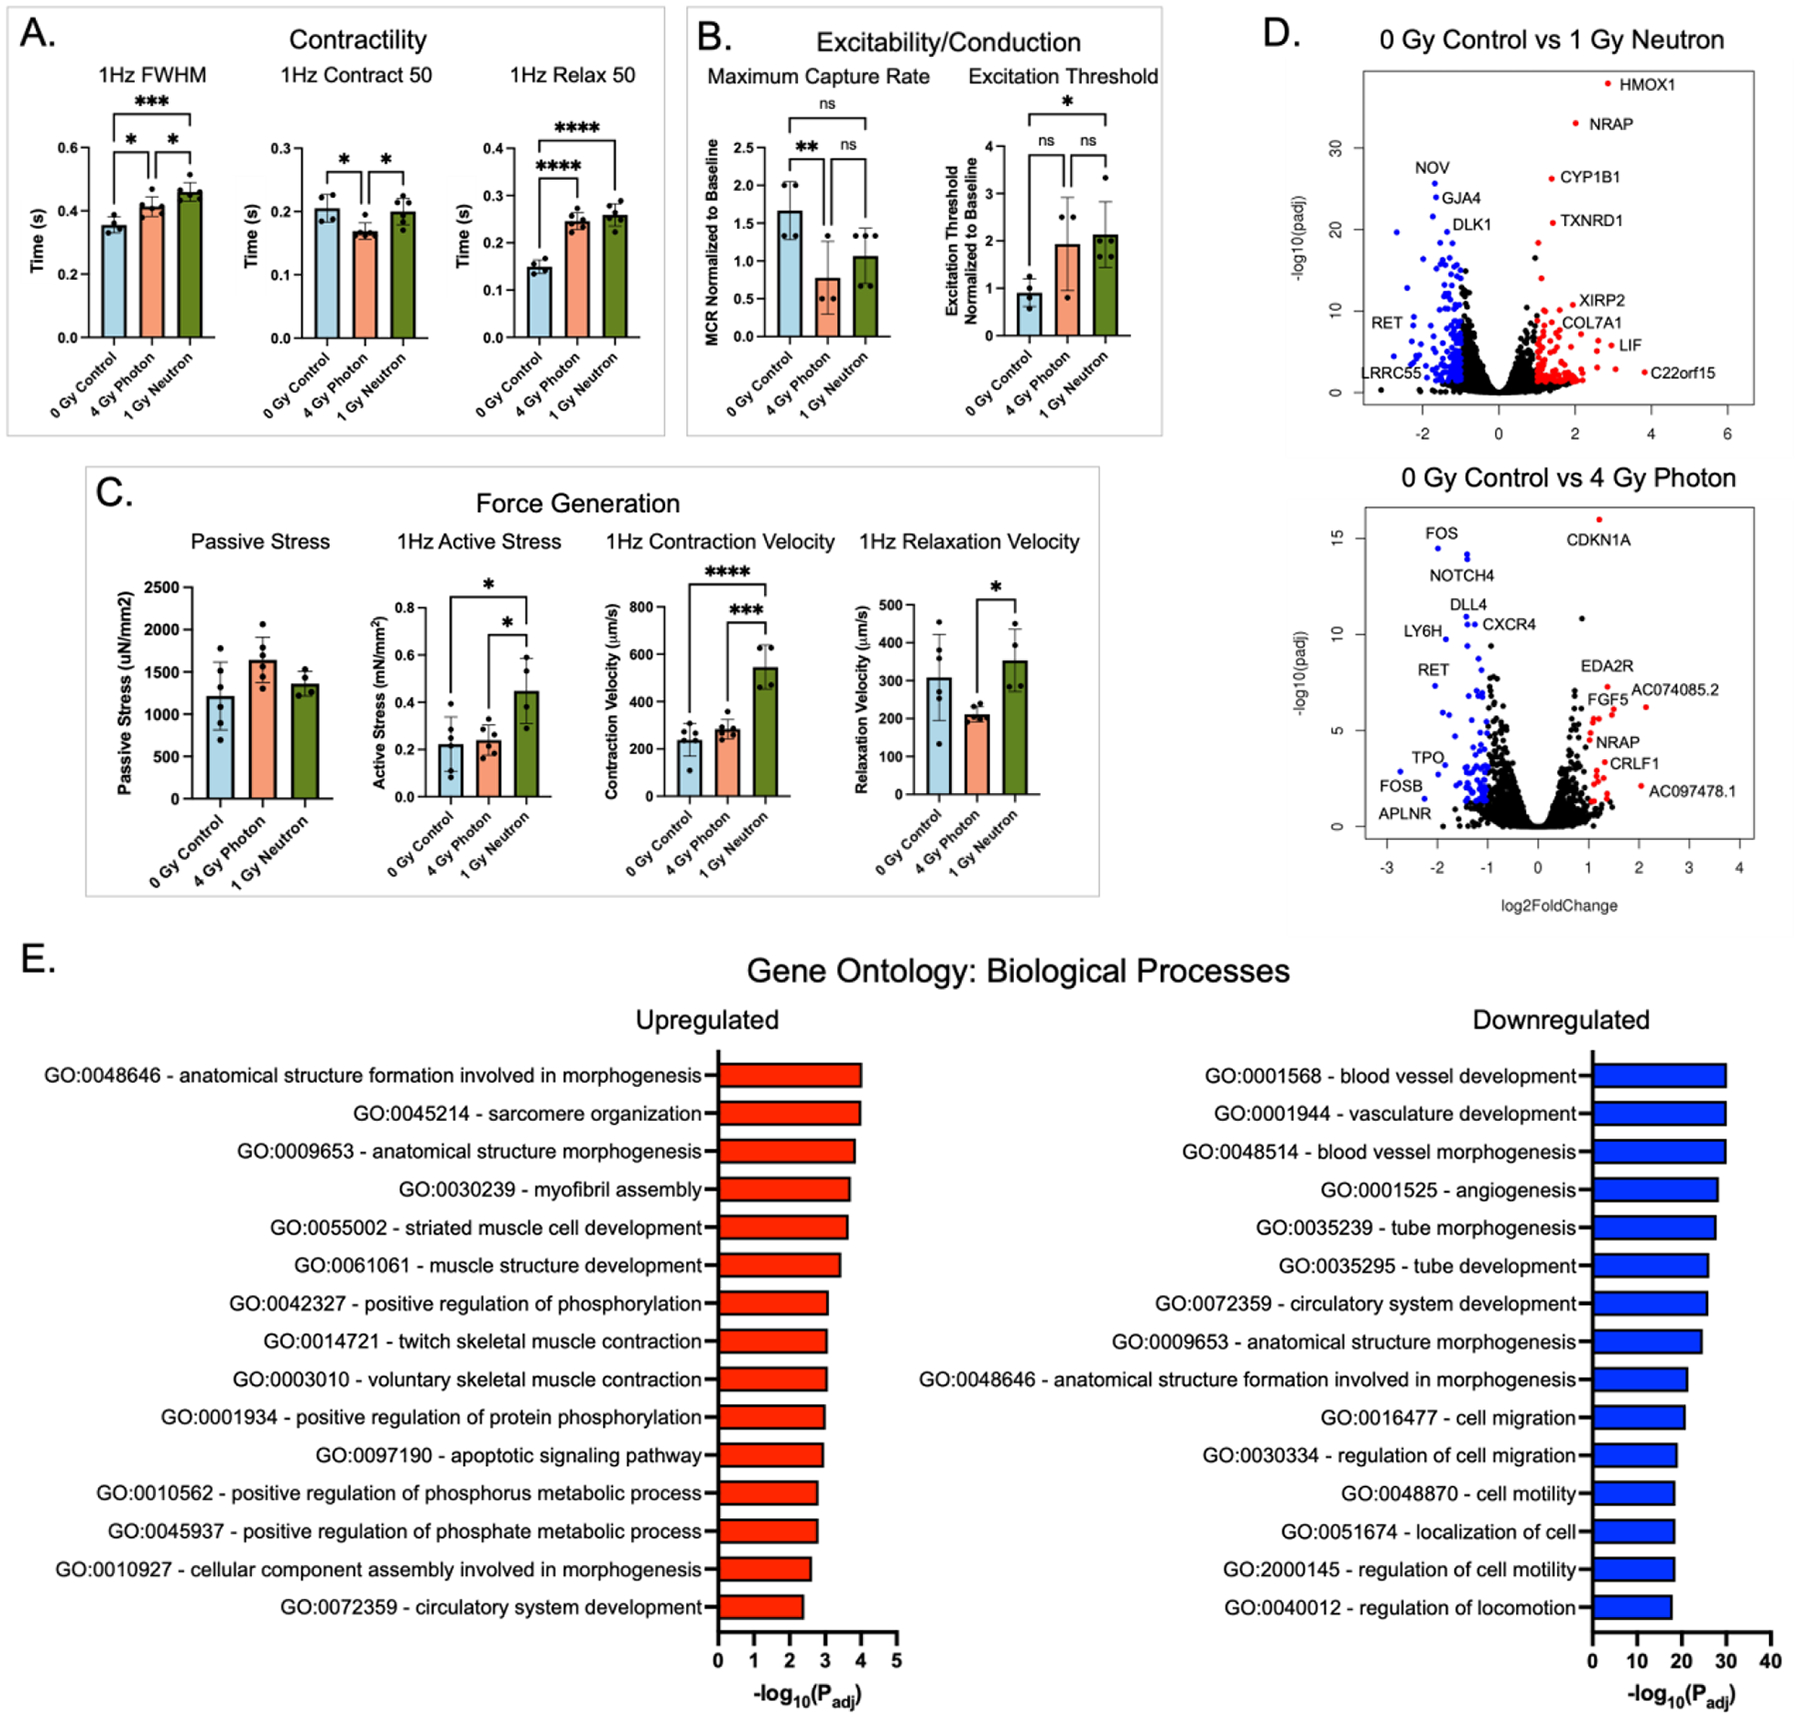
Figure 3. Acute radiation causes structural, functional, and molecular changes in engineered cardiac tissues (eCT).

(A) Contractility metrics, including full-width half-max (FWHM), contraction and relaxation lengths at 50% of peak, measured by bright field imaging and computational analysis. (B) Tissue excitability and conduction metrics, including maximum capture rate and excitation threshold, measured by calcium imaging using a GCaMP reporter line and normalized to baseline for each tissue. (C) Force generation metrics: passive and active stress, contraction and relaxation velocities, measured by bright field imaging. (D) Volcano plots showing differentially expressed genes between the irradiated and control eCTs, by RNA sequencing. (E) Biological pathways associated with significant genes in the control and neutron-irradiated groups. Data are shown as mean ± SD. *p<0.05, ** p<0.01, *** p<0.001, **** p<0.0001
