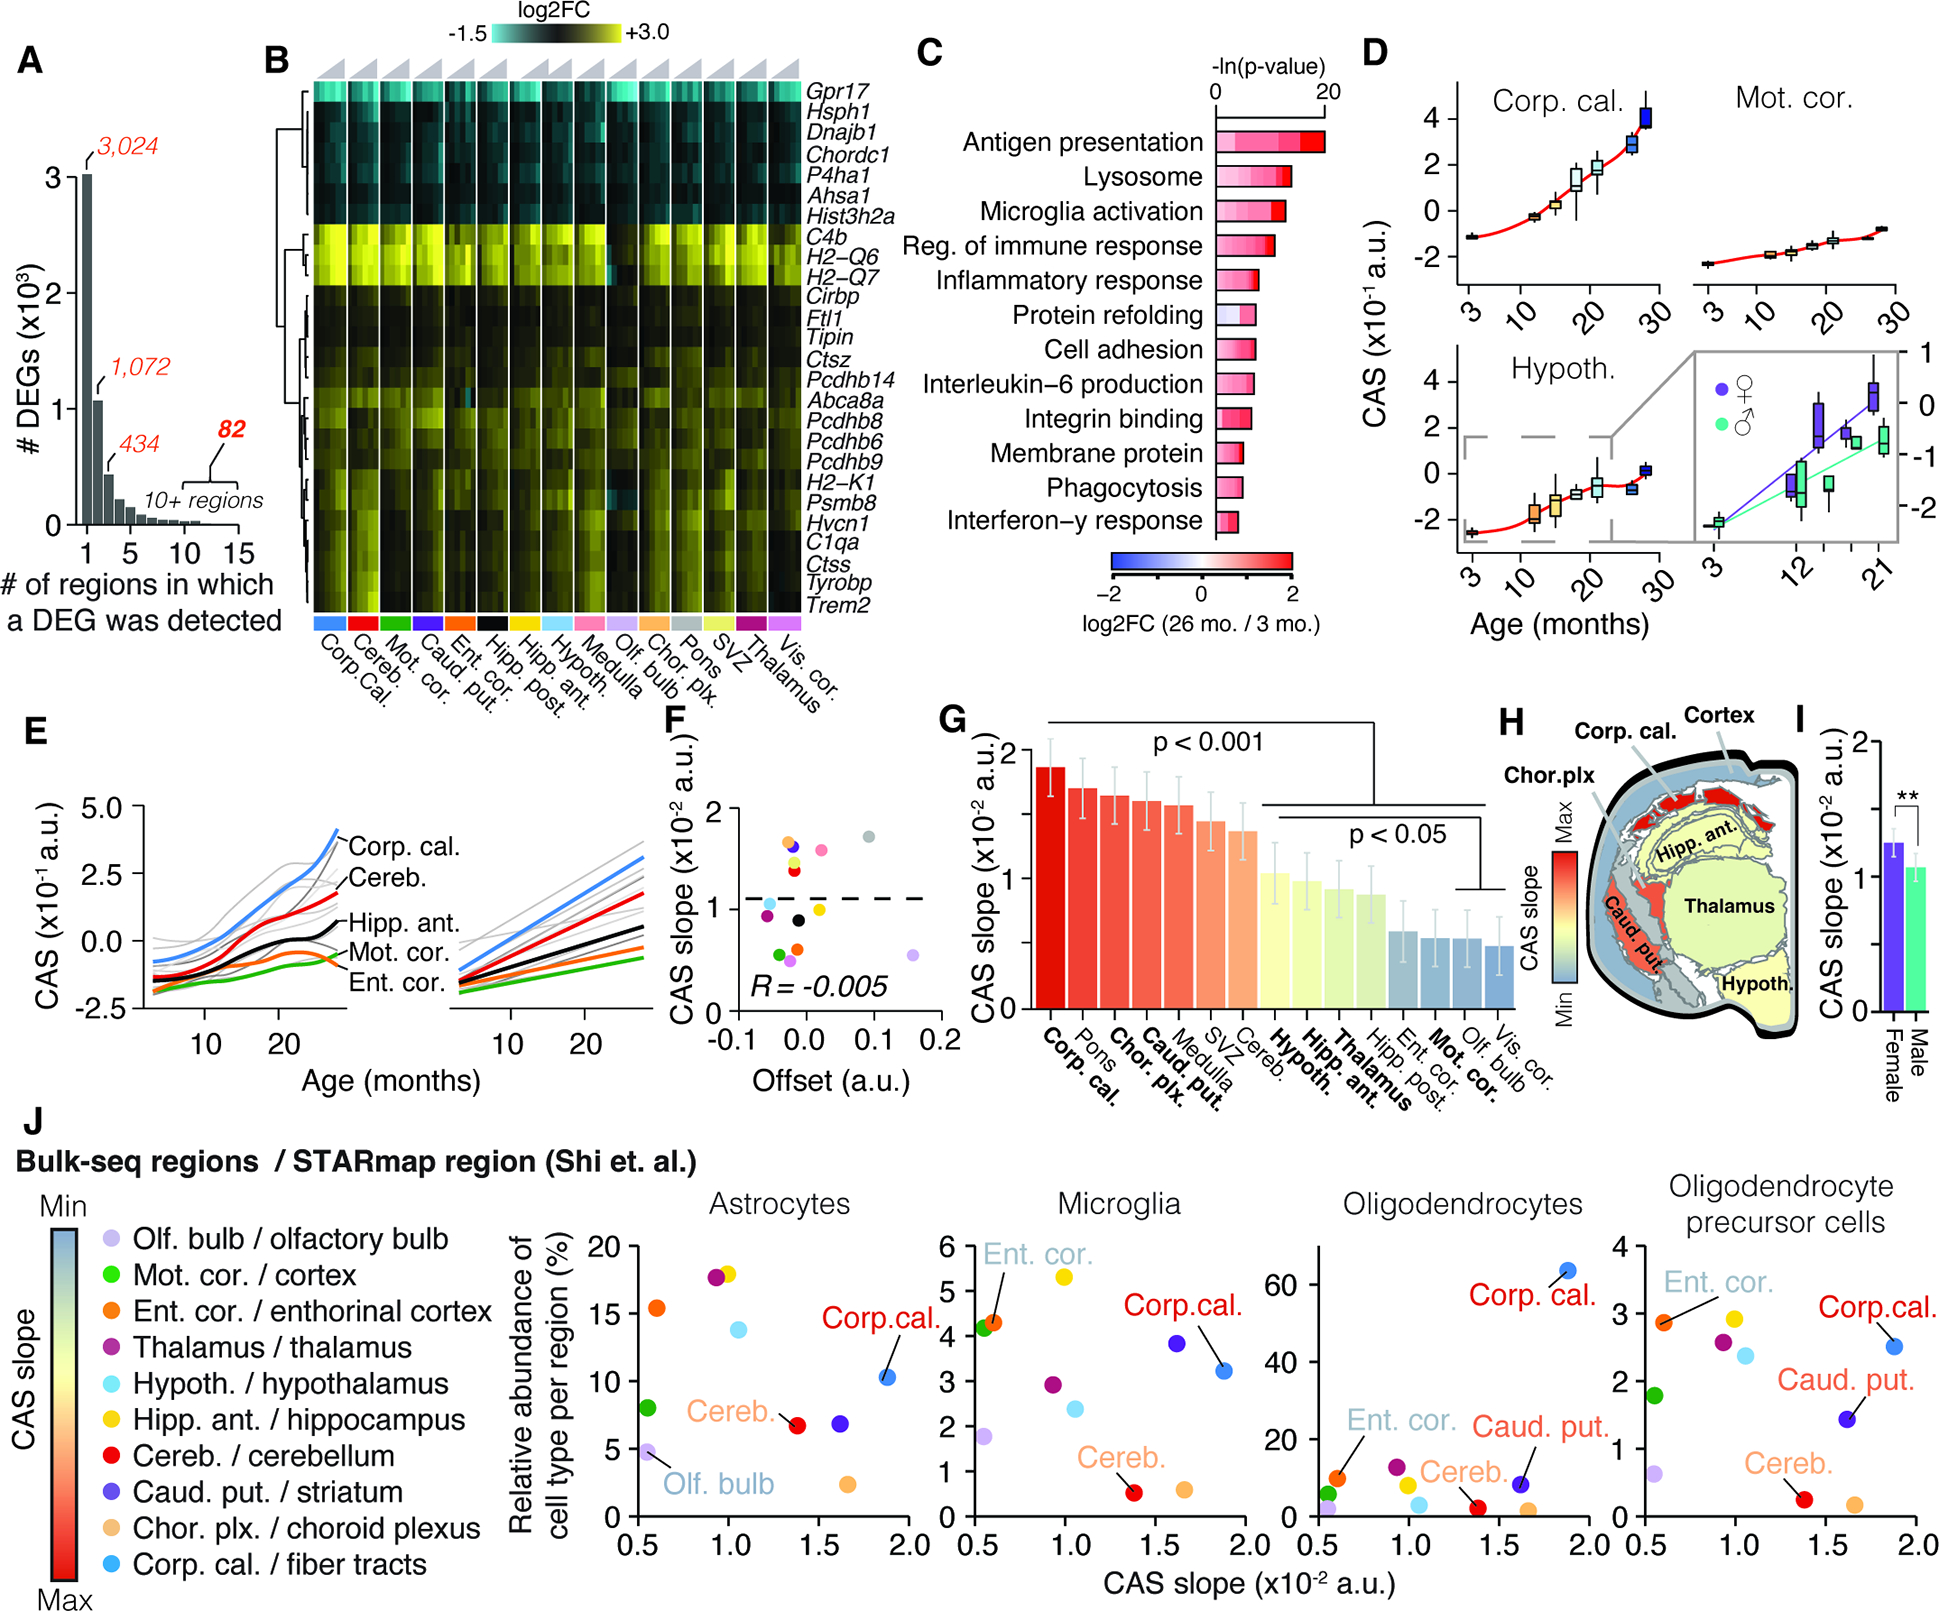
Figure 2. Common gene signature identifies regions with accelerated aging.

(A) Bar graph indicating the number of regions in which a DEG was detected (Table S1). (B) Region-wise expression changes for genes with shifts in 10 of 15 collected regions.(C) Representative GO analysis of 82 genes forming the CAS. Lengths of bars represent negative ln-transformed Padj using Fisher’s exact test. Colors indicate gene-wise log2 fold-changes in the corpus callosum. Table S1 contains full results list. (D) CAS trajectories selected regions. Insert indicates trajectories for male and females in the hypothalamus. (E) CAS trajectories of all regions approximated via LOESS and linear regression (F) Offset and slope comparison for linear models. (G) Slope of linear regressions in (D), colored by slope. Mean ± 95% confidence intervals. Two-sided Tukey’s HSD test. Bolded regions are highlighted in the following panel. (H) Mouse brain cross-section, with regions colored by CAS linear slopes.. (I) Slope of linear regression across all brain regions, colored by sex. Mean ± 95% confidence intervals. Two-sided Tukey’s HSD test. The highest (least significant) Pval is indicated. (J) Correlation of the abundance of major glia cell types (as measured in 41) with the regions’ respective CAS slopes. Significance tested through spearman correlation and linear regression.
