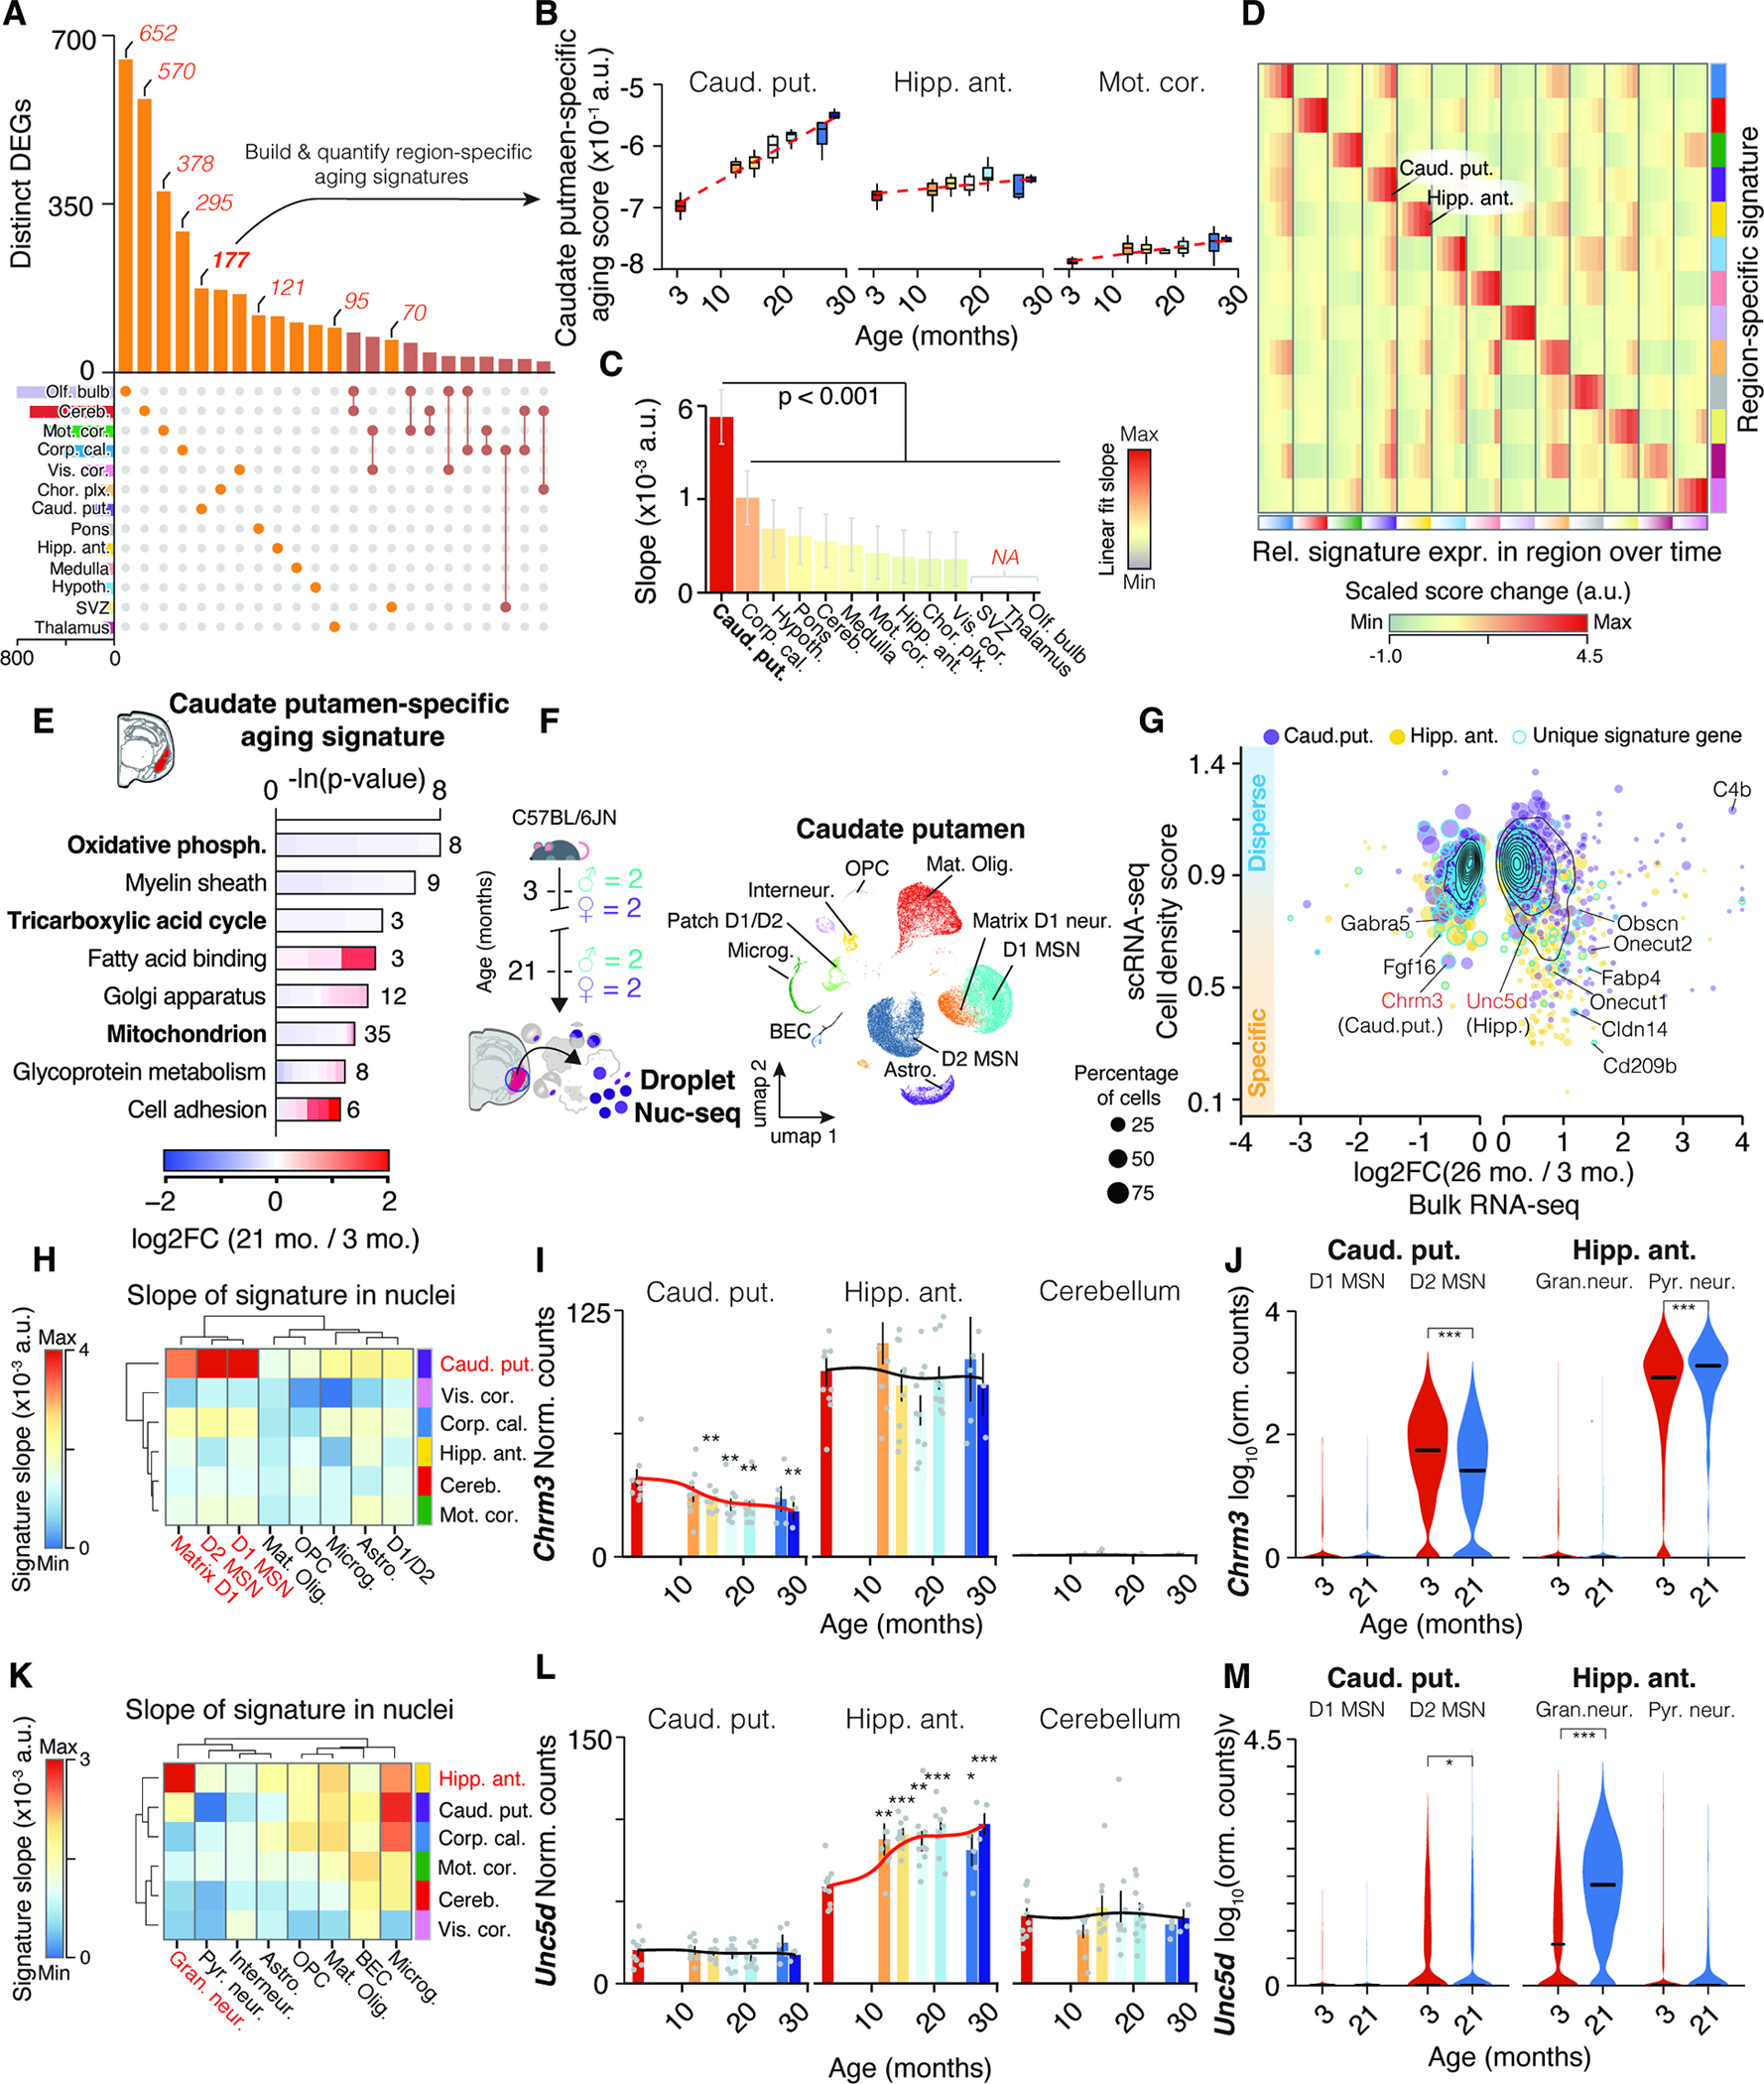
Figure 5. Neuronal transcripts encode region-specific expression shifts. (A) UpSet plot showing regional specificity of DEGs.

Unique gene sets were used to construct region-specific aging signatures. (B) Trajectories of caudate putamen-specific aging score in selected regions. (C) Slope of linear regressions in (B), colored by slope. Mean ± 95% confidence intervals. (D) Score changes for region-specific signatures relative to 3 months. Statistical analysis in Methods S3, section 2. (E) Representative GO enrichment for 177 DEGs unique to caudate putamen. Table S1 contains full results list. (F) Nuc-seq experiment overview of left-hemisphere regions from same mice used for bulk RNA-seq (n = 4; 3, 21 months). (G) Single-nuclei dispersion scores vs. log2-transformed expression ratios for different regions. Region-specific score genes are highlighted. (H) Slope of cell type-wise changes with age for caudate putamen-specific signature. D1 and D2 Medium spiny neuron populations (MSN) are highlighted. (I,J) Bulk and cell type-wise and expression changes for Chrm3. (K) Slope of cell type-wise changes with age for hippocampus-specific signature. (L-M) Bulk and cell type-wise and expression changes for Unc5d. Additional details in Methods S3, section 2.
