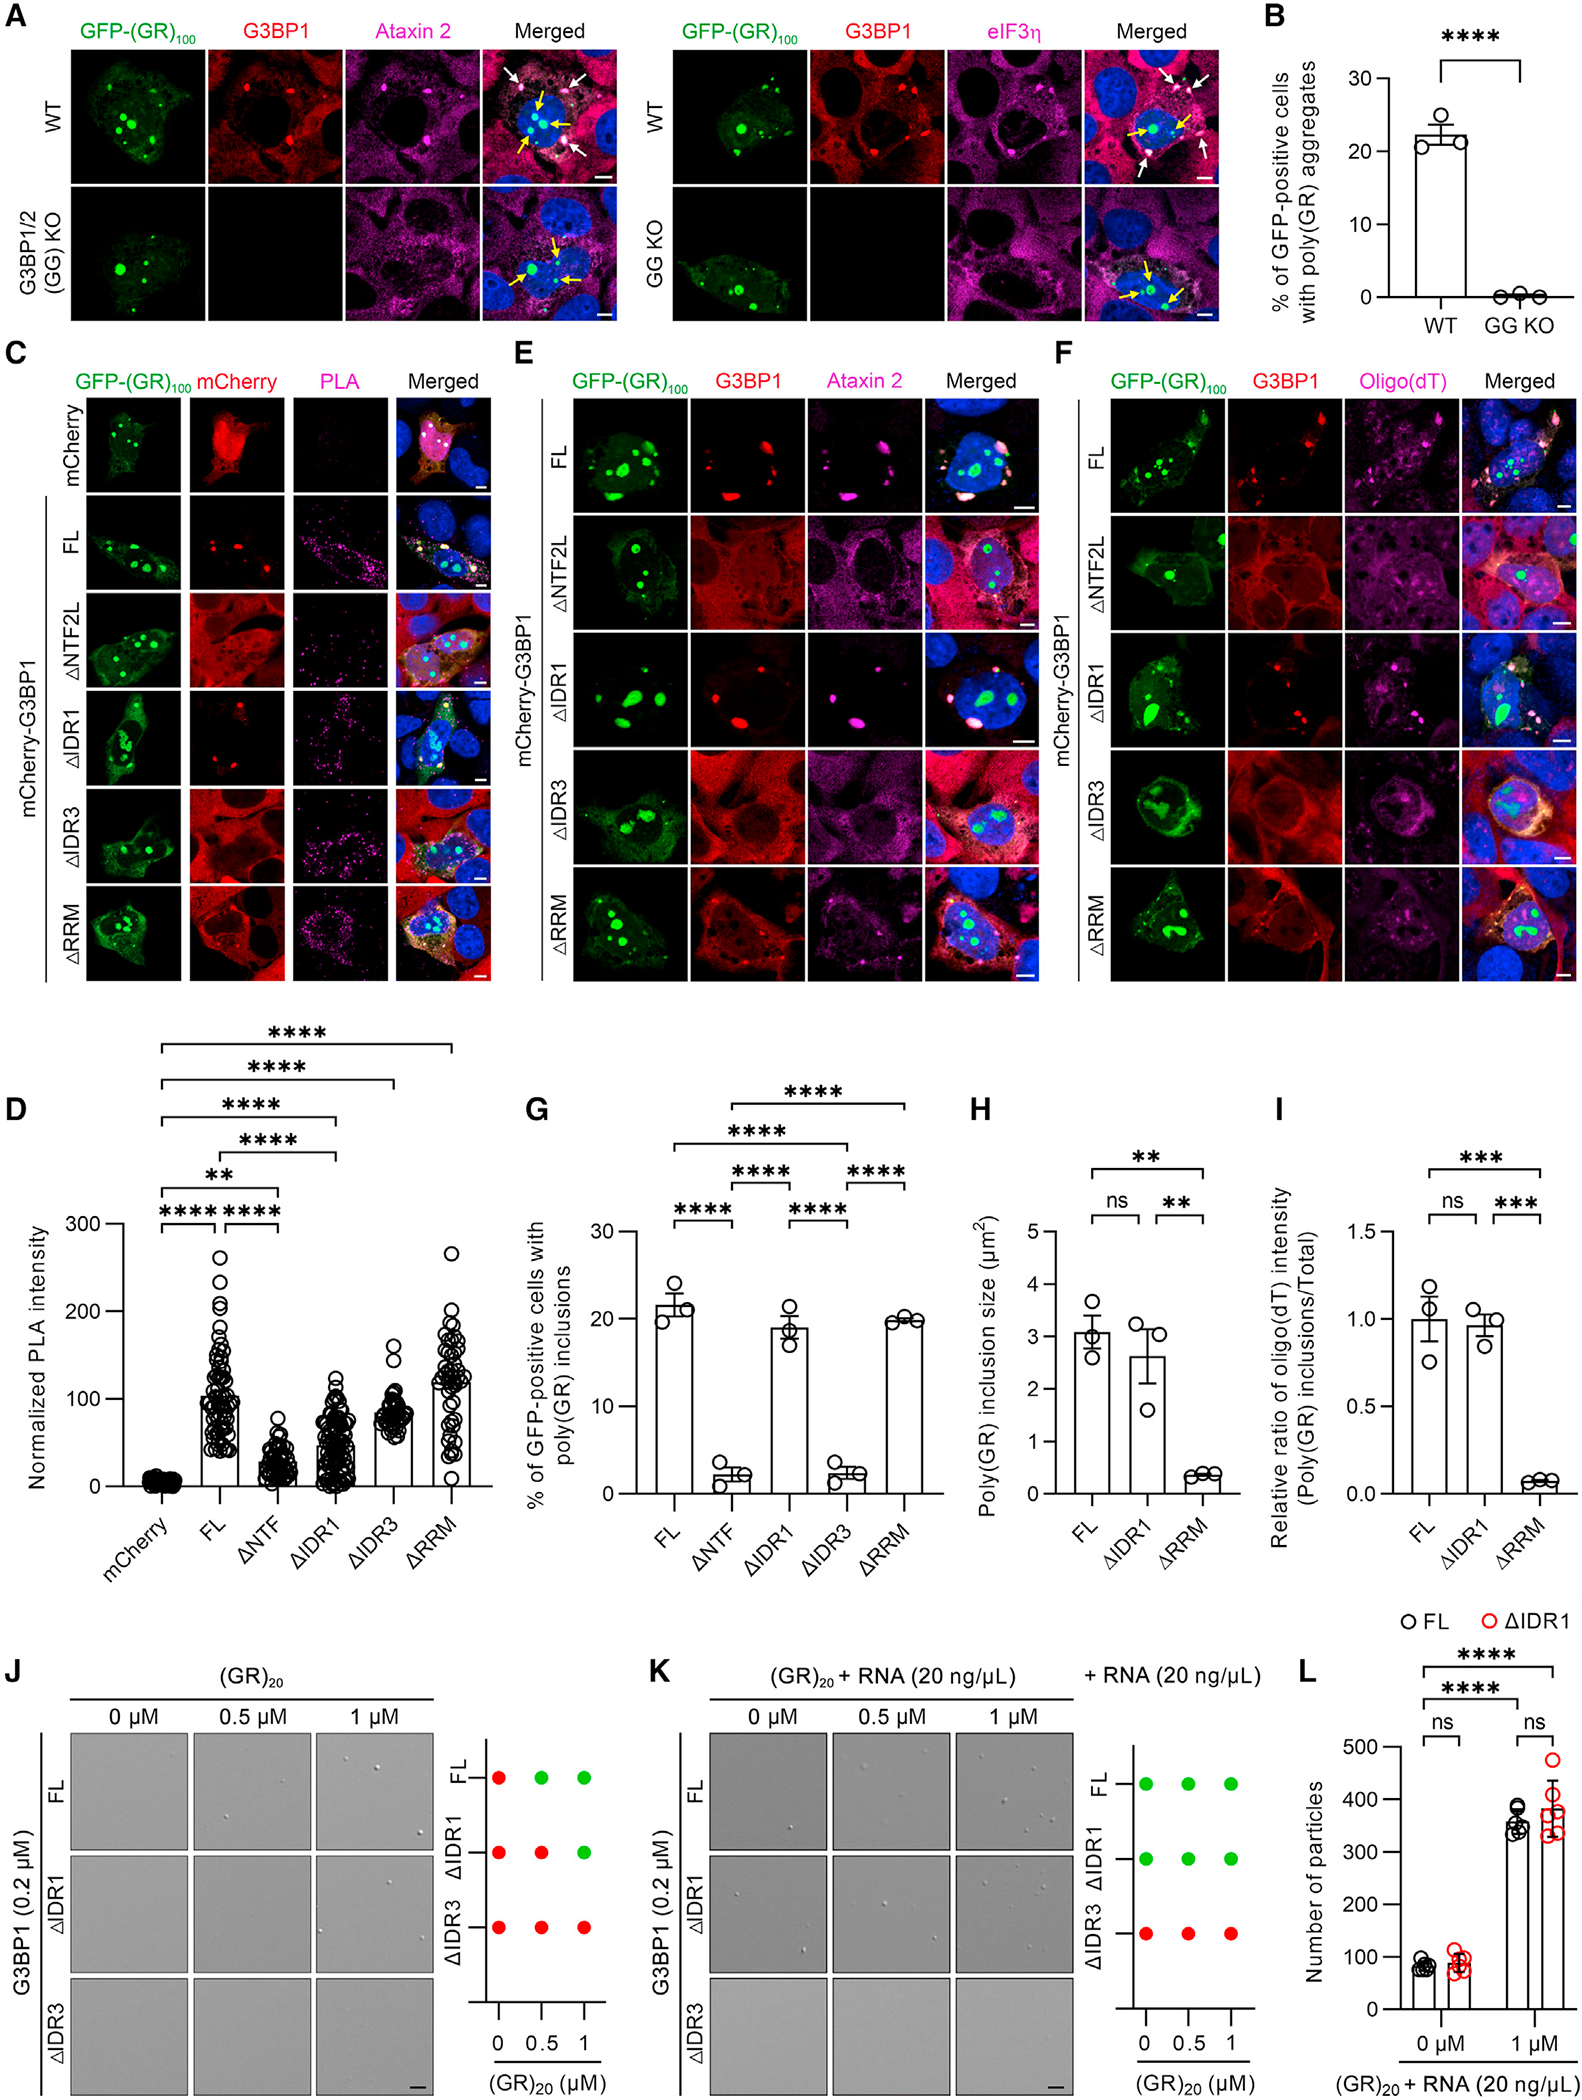
Figure 1. Poly(GR) inclusion formation requires its interaction with G3BP1 and RNA recruitment.

(A) Double-immunofluorescence staining for G3BP1 and either ataxin 2 or eIF3h in wild-type (WT) or G3BP1/2 knockout (GG KO) U2OS cells expressing GFP-(GR)100 48 h post transfection. White arrows indicate cytoplasmic poly(GR) inclusions, and yellow arrows indicate nucleolar poly(GR) accumulation. Scale bars, 5 μm.
(B) Quantification of the percentage of cells containing poly(GR) inclusions in WT or GG KO U2OS cells expressing GFP-(GR)100 48 h post transfection (n = 3 independent experiments).
(C) Representative proximity ligation assay (PLA) images for GFP-(GR)100 and mCherry in GG KO U2OS cells co-expressing GFP-(GR)100 and mCherry or for GFP-(GR)100 and mCherry-G3BP1 species in GG KO U2OS cells stably expressing mCherry-G3BP1 species. The PLA signal is indicative of these protein interactions. Scale bars, 5 μm.
(D) Quantification of the intensity for PLA signal in GG KO U2OS cells co-expressing GFP-(GR)100 and mCherry or for GFP-(GR)100 and mCherry-G3BP1 species in GG KO U2OS cells stably expressing mCherry-G3BP1 species (n = 38–87 cells).
(E) Double-immunofluorescence staining for G3BP1 and ataxin 2 in GG KO U2OS cells expressing GFP-(GR)100 and stably expressing mCherry-G3BP1 species. Scale bars, 5 μm.
(F) Immunofluorescence staining for G3BP1 followed by RNA-FISH for oligo(dT) in GG KO U2OS cells expressing GFP-(GR)100 and stably expressing mCherry-G3BP1 species. Scale bars, 5 μm.
(G) Quantification of the percentage of poly(GR)-positive cells containing poly(GR) inclusions in GG KO U2OS cells stably expressing mCherry-G3BP1 species (n = 3 independent experiments).
(H) Quantification of the size of poly(GR) inclusions in GG KO U2OS cells stably expressing mCherry-G3BP1 species (n = 3 independent experiments).
(I) Quantification of the relative ratio of oligo(dT) intensity (poly(GR) inclusions/total) in GG KO U2OS cells stably expressing mCherry-G3BP1 species (n = 3 independent experiments).
(J) Representative images (left) and phase diagram (right) of 0.2 μM of the indicated recombinant G3BP1 protein species mixed with (GR)20 peptides (0–1 μM). Scale bars, 5 μm.
(K) Representative images (left) and phase diagram (right) of 0.2 μM recombinant G3BP1 protein species mixed with (GR)20 peptides (0–1 μM) and total RNA (20 ng/μL). Scale bars, 5 μm.
(L) Quantification of the numbers of droplets of the indicated recombinant G3BP1 protein species mixed with (GR)20 peptides (0, 1 μM) and total RNA (20 ng/μL) (n = 6 regions).
Data represent the mean ± SEM. In (B), ****p < 0.0001, unpaired two-tailed t test. In (D), **p = 0.0032 and ****p < 0.0001, one-way ANOVA, Tukey’s post hoc analysis. In (G), ****p < 0.0001, one-way ANOVA, Tukey’s post hoc analysis. In (H), ns (not significant) p = 0.6381, ** (left to right) p = 0.0036 and p = 0.0089, one-way ANOVA, Tukey’s post hoc analysis. In (I), ns = 0.9485, *** (left to right) p = 0.0005 and p = 0.0006, one-way ANOVA, Tukey’s post hoc analysis. In (L), (left to right) ns = 0.9884 and ns = 0.5207, ****p < 0.0001, two-way ANOVA, Tukey’s post hoc analysis.
