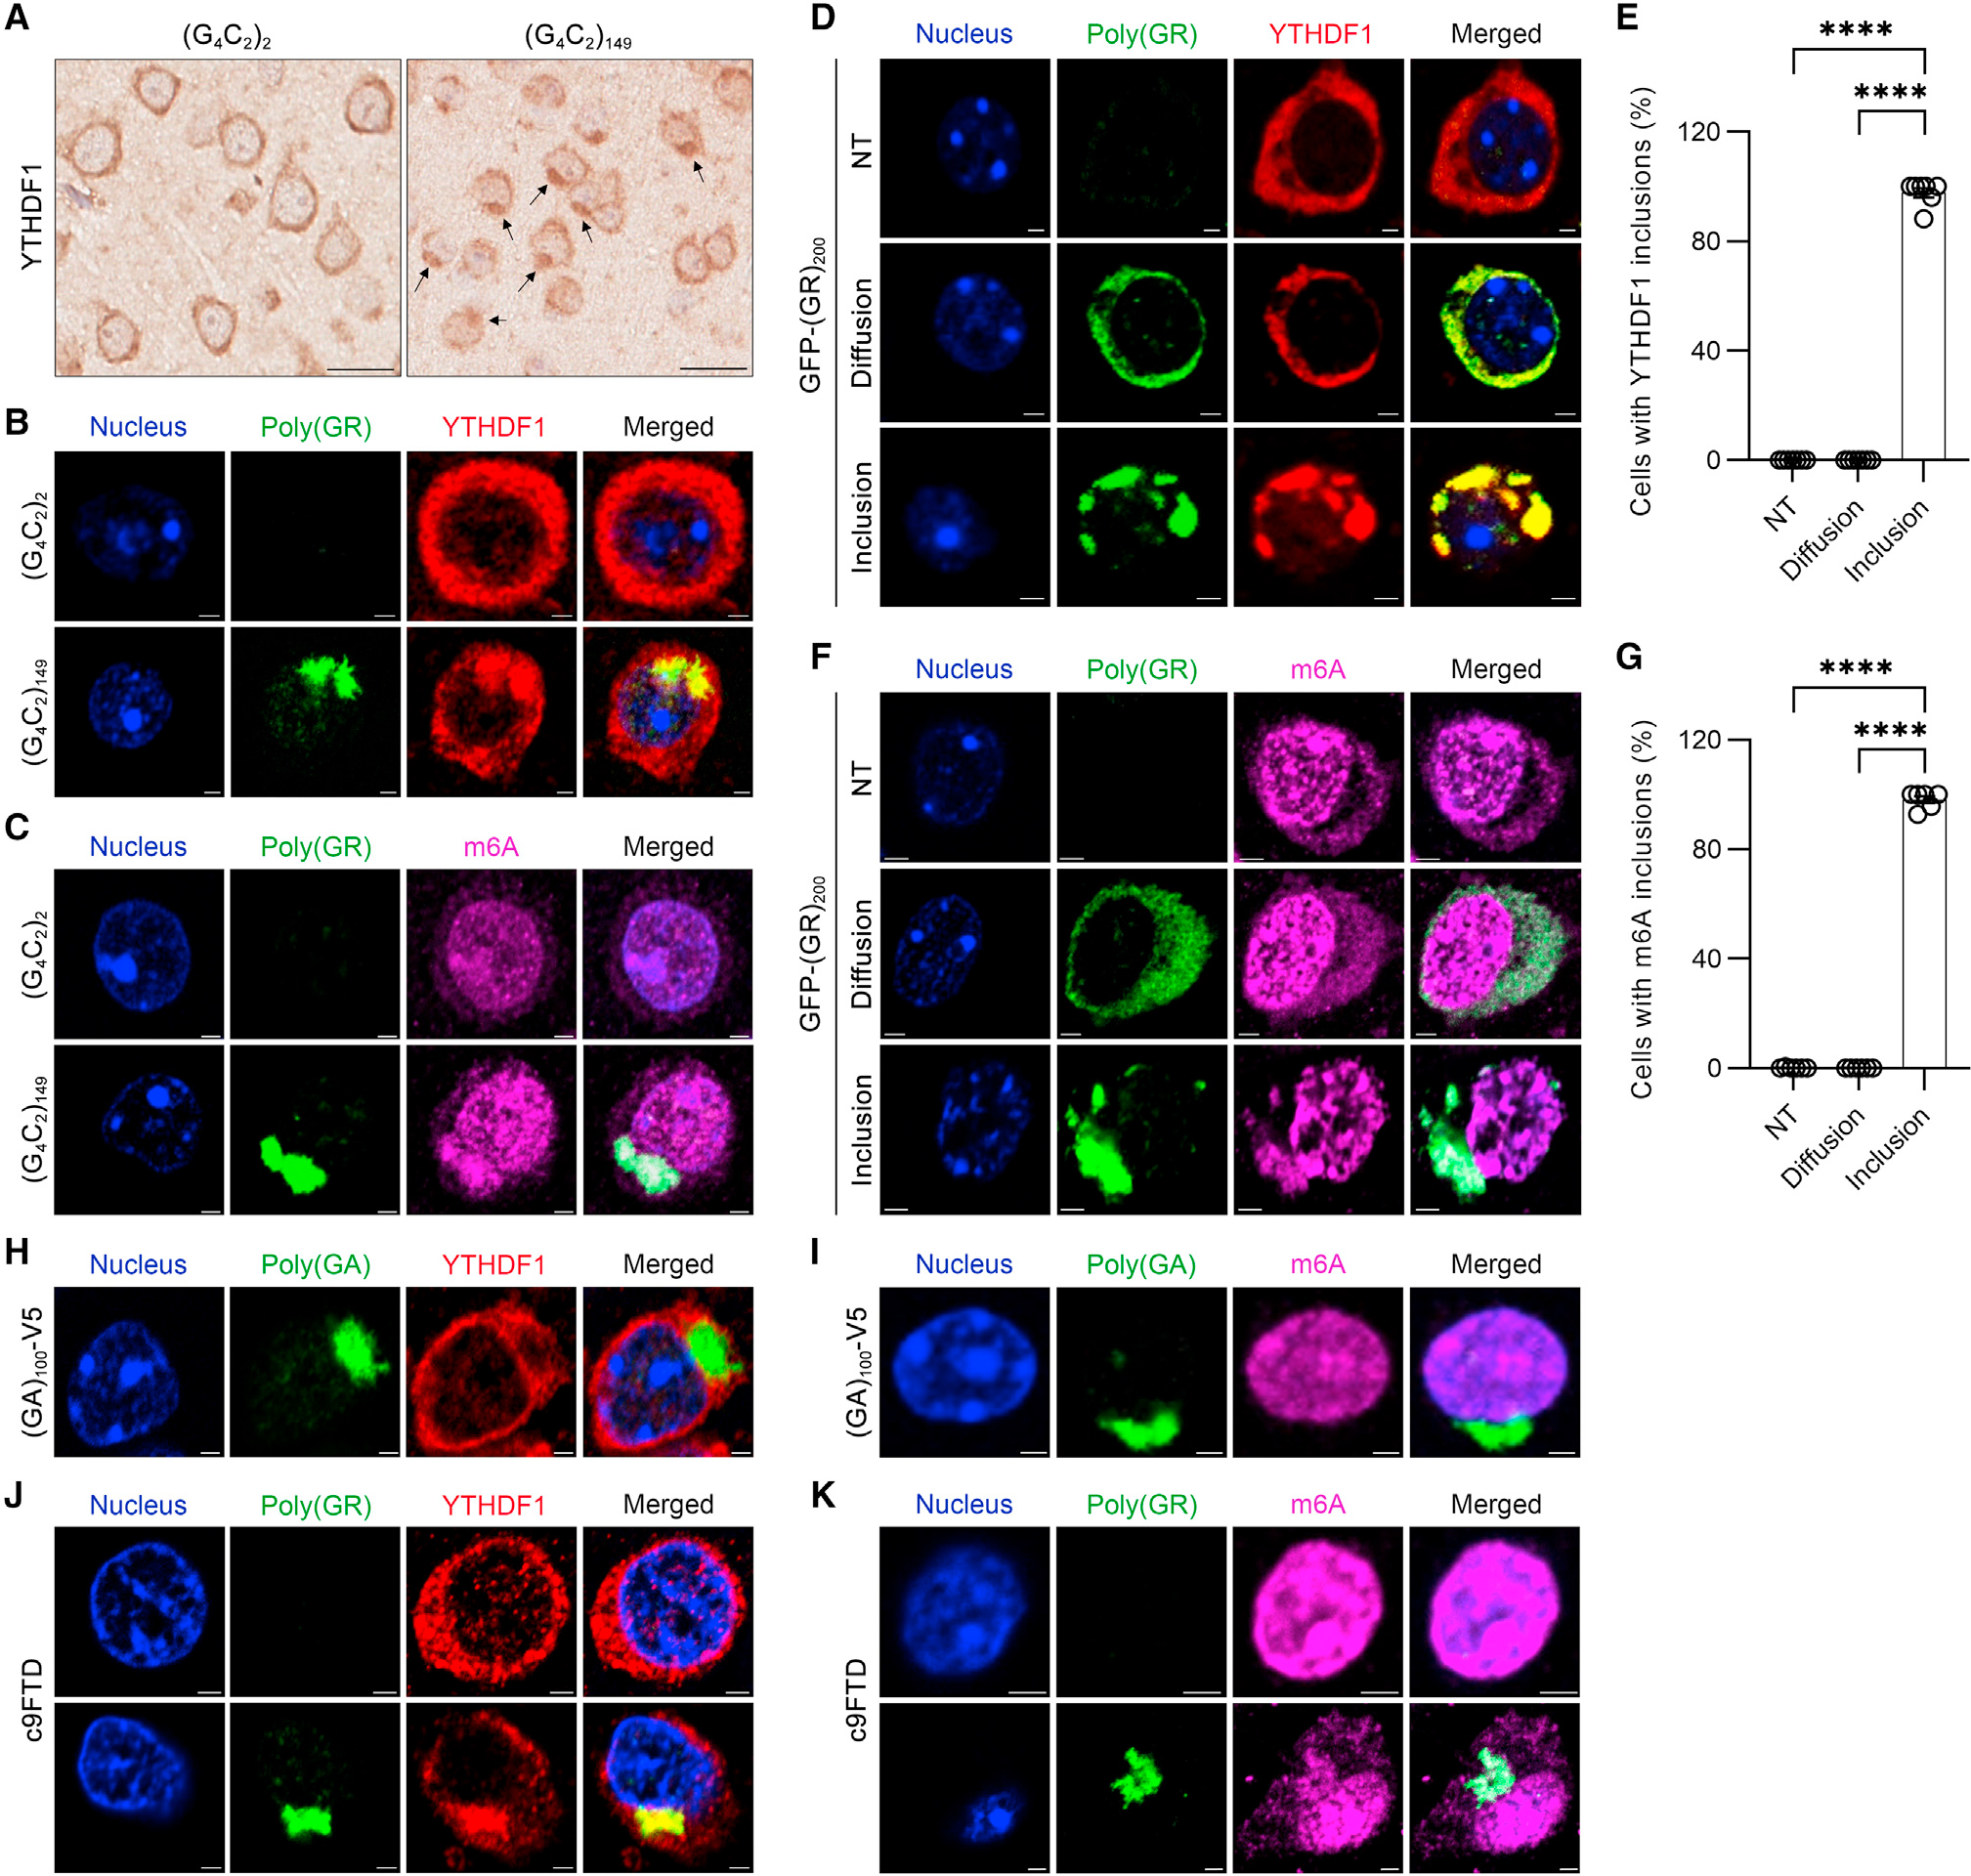
Figure 2. YTHDF1 and m6A-modified RNAs co-localize with cytoplasmic poly(GR) inclusions.

(A) Representative images of immunohistochemical analysis of YTHDF1 in the cortex of 12-month-old (G4C2)2 or (G4C2)149 mice (n = 6 per group). Black arrows indicate inclusions. Scale bars, 20 μm.
(B) Double-immunofluorescence staining for poly(GR) and YTHDF1 in the cortex of 12-month-old (G4C2)2 or (G4C2)149 mice (n = 6 per group). Scale bars, 2 μm.
(C) Double-immunofluorescence staining for poly(GR) and m6A-modified RNAs in the cortex of 12-month-old (G4C2)2 or (G4C2)149 mice. Scale bars, 2 μm.
(D) Double-immunofluorescence staining for poly(GR) and YTHDF1 in the cortex of 2-week-old GFP-(GR)200 mice. Scale bars, 2 μm. NT, non-transduced cells; Diffusion, cells with diffuse poly(GR); Inclusion, cells with poly(GR) inclusions.
(E) Quantification of the percentage of NT cells and transduced cells with diffuse poly(GR) or poly(GR) inclusions with YTHDF1 inclusions (n = 6).
(F) Double-immunofluorescence staining for poly(GR) and m6A-modified RNAs in the cortex of 2-week-old GFP-(GR)200 mice. Scale bars, 2 μm.
(G) Quantification of the percentage of NT cells or transduced cells with diffuse poly(GR) or poly(GR) inclusion with m6A-modified RNA-containing inclusions (n = 6).
(H) Double-immunofluorescence staining for poly(GA) and YTHDF1 in the cortex of 3.5-month-old (GA)100-V5 mice (n = 3). Scale bars, 2 μm.
(I) Double-immunofluorescence staining for poly(GA) and m6A-modified RNAs in the cortex of 3.5-month-old (GA)100-V5 mice (n = 3). Scale bars, 2 μm.
(J) Double-immunofluorescence staining for poly(GR) and YTHDF1 in the mid-frontal cortex of patients with c9FTD. The intracellular localization of YTHDF1 is shown for cells without or with poly(GR) inclusions (n = 6). Scale bars, 2 μm.
(K) Double-immunofluorescence staining for poly(GR) and m6A-modified RNAs in the mid-frontal cortex of patients with c9FTD. The intracellular localization of m6A-modified RNA is shown for cells without and with poly(GR) inclusions (n = 6). Scale bars, 2 μm.
Data are shown as the mean ± SEM. In (E), ****p < 0.0001, one-way ANOVA, Tukey’s post hoc analysis. In (G), ****p < 0.0001, one-way ANOVA, Tukey’s post hoc analysis.
