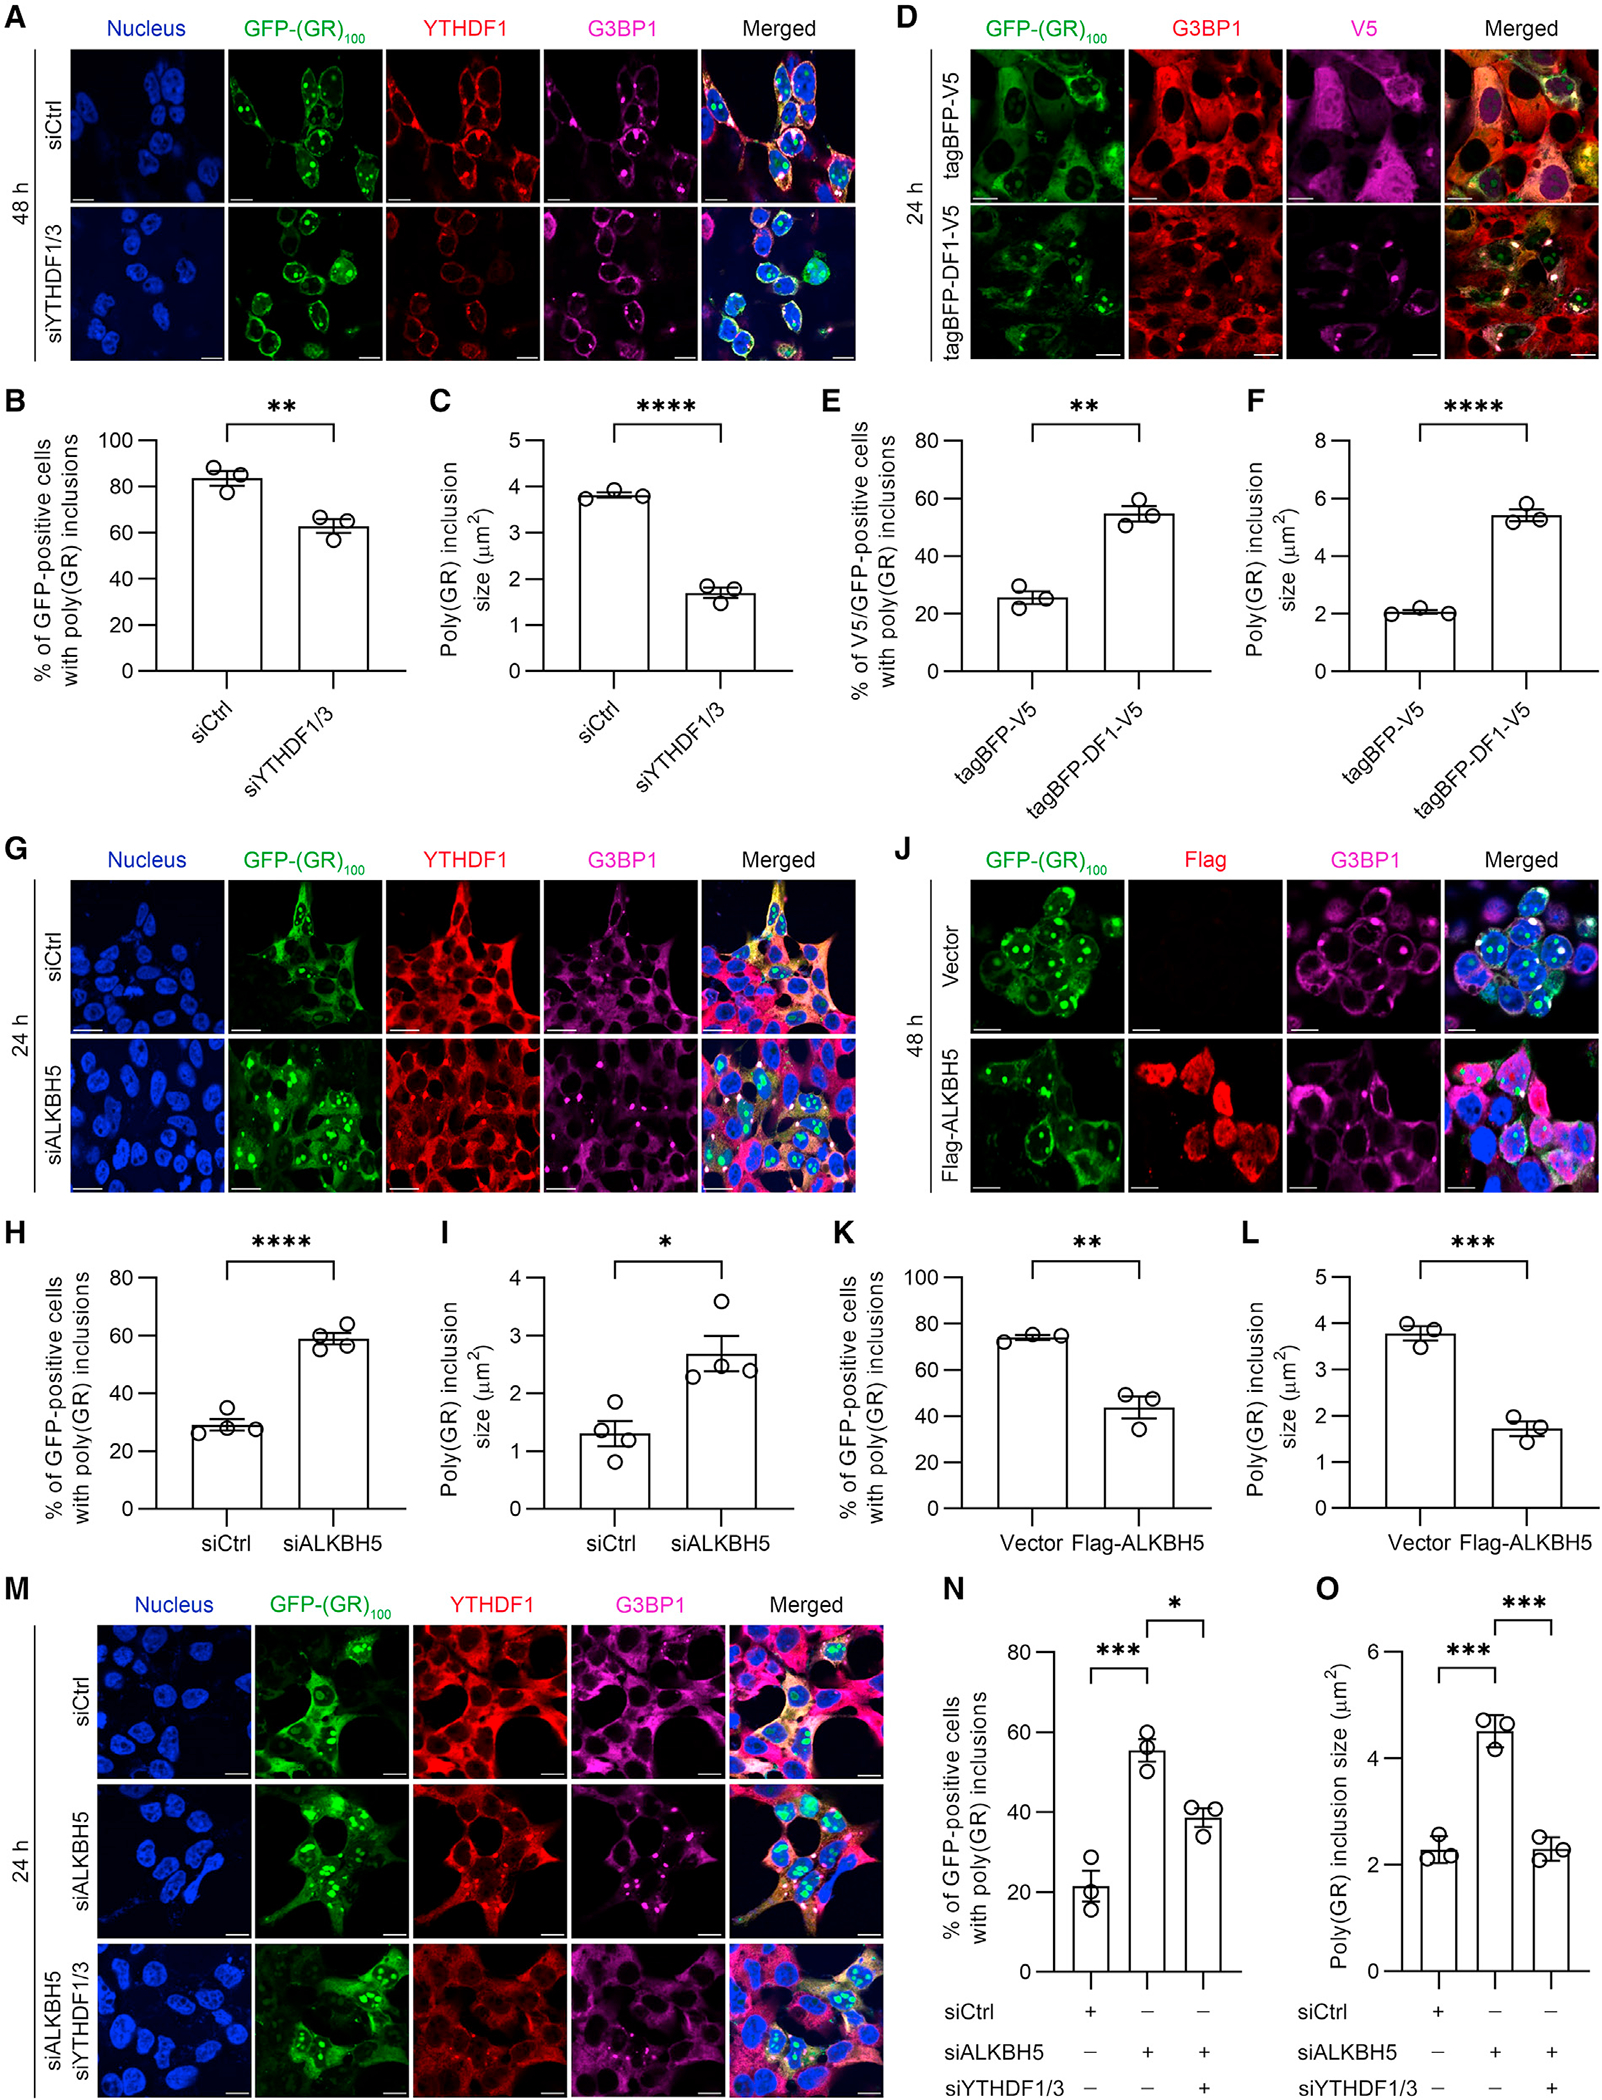
Figure 3. YTHDF proteins and m6A-modified RNAs promote cytoplasmic poly(GR) inclusion formation.

(A) Double-immunofluorescence staining for YTHDF1 and G3BP1 in YTHDF1/3-depleted HEK293T cells expressing GFP-(GR)100 48 h post transfection. Scale bars, 10 μm.
(B) Quantification of the percentage of GFP-positive cells containing poly(GR) inclusions in YTHDF1/3-depleted HEK293T cells expressing GFP-(GR)100 (n = 3 independent experiments).
(C) Quantification of the size of poly(GR) inclusions in YTHDF1/3-depleted HEK293T cells expressing GFP-(GR)100 (n = 3 independent experiments).
(D) Double-immunofluorescence staining for V5 and G3BP1 in HEK293T cells co-expressing GFP-(GR)100 and either tagBFP-V5 or tagBFP/V5 tagged wild-type YTHDF1 (tagBFP-DF1-V5). Scale bars, 10 μm.
(E) Quantification of the percentage of GFP-positive cells containing poly(GR) inclusions in HEK293T cells co-expressing GFP-(GR)100 and either tagBFP-V5 or tagBFP-DF1-V5 (n = 3 independent experiments).
(F) Quantification of the size of poly(GR) inclusions in GFP-(GR)100 overexpressing HEK293T cells co-expressing either tagBFP-V5 or tagBFP-DF1-V5 (n = 3 independent experiments).
(G) Double-immunofluorescence staining for YTHDF1 and G3BP1 in ALKBH5-depleted HEK293T cells expressing GFP-(GR)100. Staining was performed 24 h after GFP-(GR)100 transfection. Scale bars, 20 μm.
(H) Quantification of the percentage of GFP-positive cells containing poly(GR) inclusions in ALKBH5-depleted HEK293T cells expressing GFP-(GR)100 (n = 4 independent experiments).
(I) Quantification of the size of poly(GR) inclusions in ALKBH5-depleted HEK293T cells expressing GFP-(GR)100 (n = 4 independent experiments).
(J) Double-immunofluorescence staining for Flag and G3BP1 in Flag-ALKBH5 overexpressing HEK293T cells co-expressing GFP-(GR)100. Scale bars, 20 μm.
(K) Quantification of the percentage of GFP-positive cells with poly(GR) inclusions in Flag-ALKBH5 overexpressing HEK293T cells co-expressing GFP-(GR)100 (n = 3 independent experiments).
(L) Quantification of the size of poly(GR) inclusions in Flag-ALKBH5 and GFP-(GR)100 co-expressing HEK293T cells (n = 3 independent experiments).
(M) Double-immunofluorescence staining for YTHDF1 and G3BP1 in HEK293T cells expressing GFP-(GR)100 in which only ALKBH5 was depleted or in which ALKBH5 and YTHDF1/3 were depleted. Scale bars, 20 μm.
(N) Quantification of the percentage of GFP-positive cells containing poly(GR) inclusions in HEK293T cells expressing GFP-(GR)100 in which only ALKBH5 was depleted or in which ALKBH5 and YTHDF1/3 were depleted (n = 3 independent experiments).
(O) Quantification of the size of poly(GR) inclusions in ALKBH5-depleted or ALKBH5 and YTHDF1/3-depleted HEK293T cells expressing GFP-(GR)100 (n = 3 independent experiments).
Data are shown as mean ± SEM. In (B), **p = 0.0095, unpaired two-tailed t test. In (C), ****p < 0.0001, unpaired two-tailed t test. In (E), **p = 0.0011, unpaired two-tailed t test. In (F), ****p < 0.0001, unpaired two-tailed t test. In (H), ****p < 0.0001, unpaired two-tailed t test. In (I), *p = 0.0101, unpaired two-tailed t test. In (K), **p = 0.0033, unpaired two-tailed t test. In (L), ***p = 0.0007, unpaired two-tailed t test. In (N), ***p = 0.0006 and *p = 0.0193, one-way ANOVA, Tukey’s post hoc analysis. In (O), *** (left to right) p = 0.0001 and p = 0.0001, one-way ANOVA, Tukey’s post hoc analysis.
