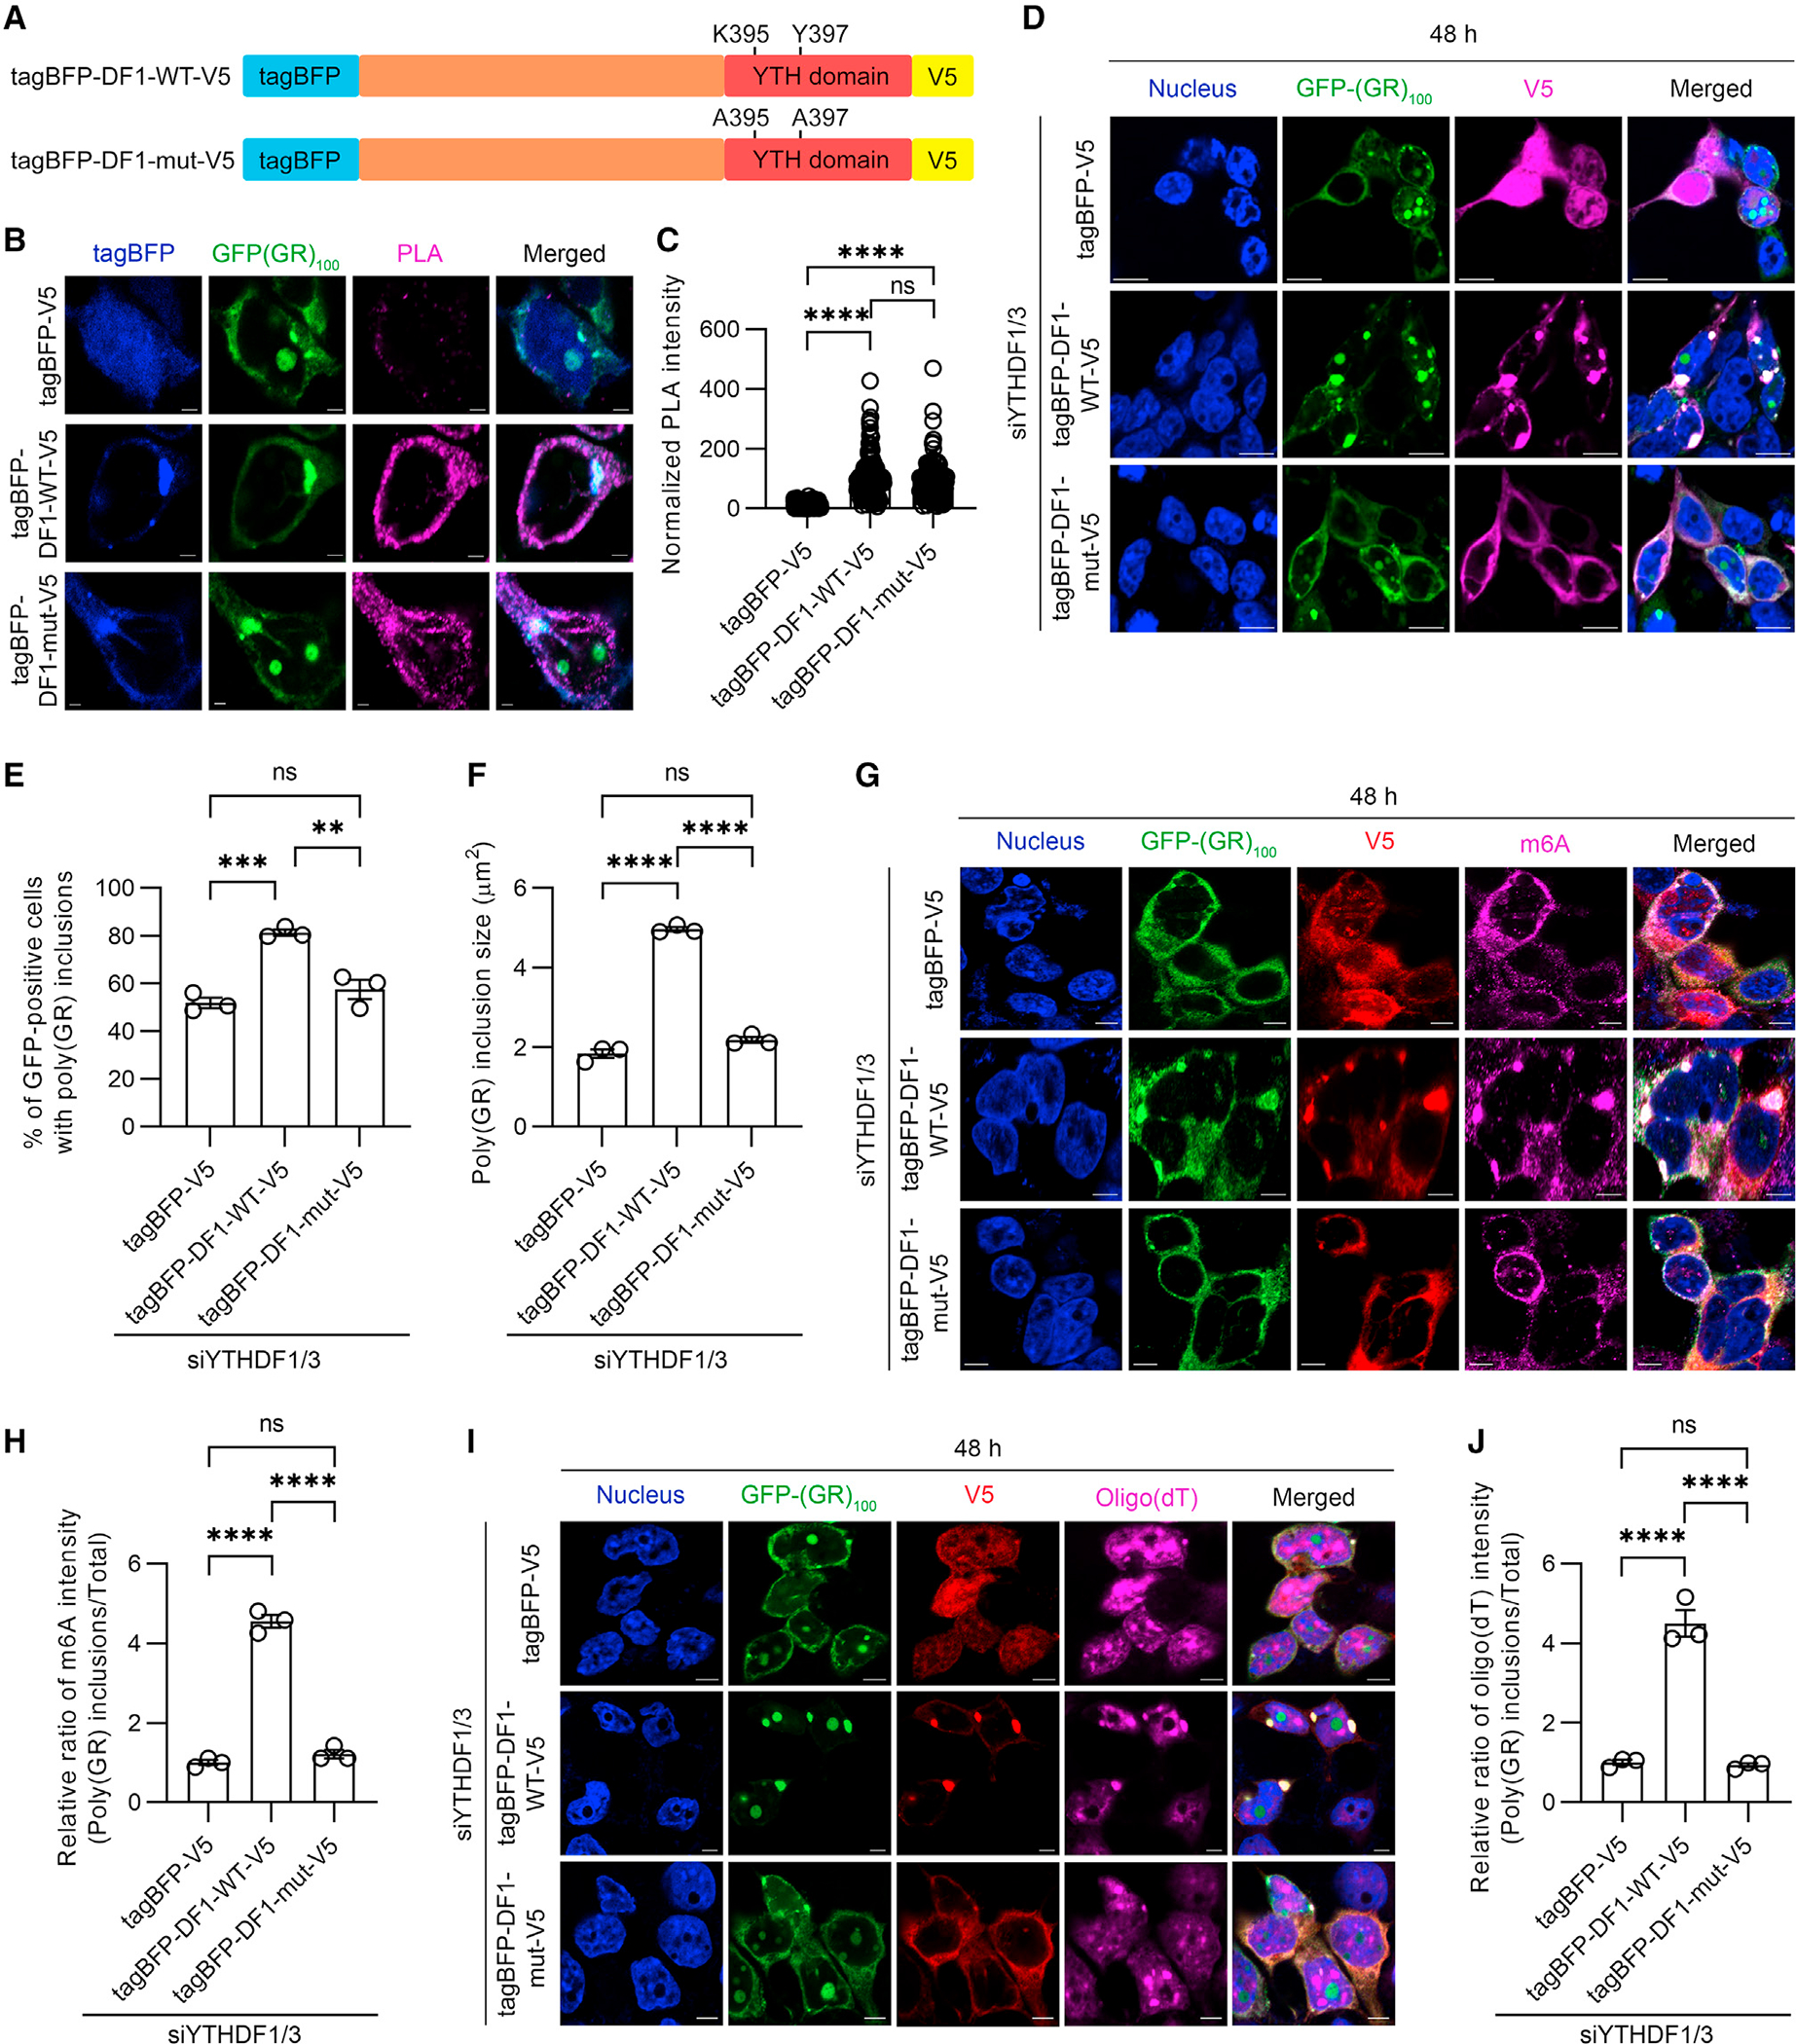
Figure 4. YTHDF proteins incorporate mRNA into poly(GR) inclusions via m6A-modified RNA binding.

(A) Schematic of the tagBFP/V5 tagged YTHDF1 wild-type (tagBFP-DF1-WT-V5) and mutant (tagBFP-DF1-mut-V5) constructs, the latter having mutations in the YTH domain that impair the ability of YTHDF1 to bind m6A-modified RNA (top).
(B) Representative images of proximity ligation assay (PLA) for GFP-(GR)100 and tagBFP or tagBFP-YTHDF1 species in HEK293T cells co-expressing GFP-(GR)100 and tagBFP or tagBFP-YTHDF1 species. Scale bars, 2 μm.
(C) Quantification of the intensity for PLA signal in HEK293T cells co-expressing GFP-(GR)100 and tagBFP or tagBFP-YTHDF1 species (n = 152–176 cells).
(D) Immunofluorescence staining for V5 in YTHDF1/3-depleted HEK293T cells expressing GFP-(GR)100 and either tagBFP-V5, tagBFP-DF1-WT-V5 or tagBFP-DF1-mut-V5. Scale bars, 10 μm.
(E) Quantification of the percentage of cells with poly(GR) inclusions in YTHDF1/3-depleted HEK293T cells expressing GFP-(GR)100 and either tagBFP-V5, tagBFP-DF1-WT-V5, or tagBFP-DF1-mut-V5 (n = 3 independent experiments).
(F) Quantification of the size of poly(GR) inclusions in YTHDF1/3-depleted HEK293T cells expressing GFP-(GR)100 and either tagBFP-V5, tagBFP-DF1-WT-V5, or tagBFP-DF1-mut-V5 (n = 3 independent experiments).
(G) Triple-immunofluorescence staining for GFP, V5, and m6A in YTHDF1/3-depleted HEK293T cells expressing GFP-(GR)100 and either tagBFP-V5, tagBFP-DF1-WT-V5, or tagBFP-DF1-mut-V5. Scale bars, 5 μm.
(H) Quantification of the relative ratio of m6A intensity (poly(GR) inclusions/total) from YTHDF1/3-depleted HEK293T cells expressing GFP-(GR)100 and either tagBFP-V5, tagBFP-DF1-WT-V5, or tagBFP-DF1-mut-V5 (n = 3 independent experiments).
(I) Immunofluorescence staining for V5 followed by RNA-FISH for oligo(dT) in YTHDF1/3-depleted HEK293T cells expressing GFP-(GR)100 and tagBFP-V5, tagBFP-DF1-WT-V5, or tagBFP-DF1-mut-V5. Scale bars, 5 μm.
(J) Quantification of the relative ratio of oligo(dT) intensity (poly(GR) inclusions/total) from YTHDF1/3-depleted HEK293T cells expressing GFP-(GR)100 and either tagBFP-V5, tagBFP-DF1-WT-V5, or tagBFP-DF1-mut-V5 (n = 3 independent experiments).
Data are shown as mean ± SEM. In (C), ****p < 0.0001 and ns p = 0.0547, one-way ANOVA, Tukey’s post hoc analysis. In (E), ***p = 0.0007, **p = 0.0022, and ns (not significant) p = 0.3670, one-way ANOVA, Tukey’s post hoc analysis. In (F), ****p < 0.0001 and ns p = 0.0576, one-way ANOVA, Tukey’s post hoc analysis. In (H), ****p < 0.0001 and ns p = 0.4376, one-way ANOVA, Tukey’s post hoc analysis. In (J), ****p < 0.0001 and ns p = 0.9690, one-way ANOVA, Tukey’s post hoc analysis.
