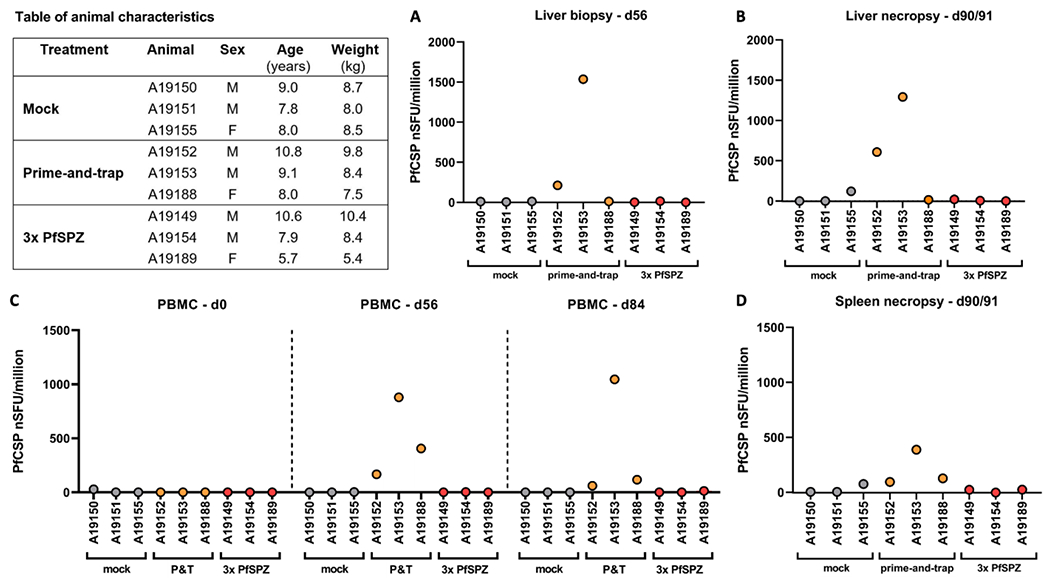
Figure 2. Cellular response to vaccination as measured by PfCSP peptide IFNγ ELISPOT. Inset: Table of animal characteristics.

A. Responses in liver lymphocytes obtained post-vaccination by surgery on day 56. B. Responses in liver lymphocytes from six days post-PfSPZ recall exposure at necropsy. C. Responses in PBMCs on days 0, 56, and 84. D. Responses in splenocytes from six days post-PfSPZ recall exposure at necropsy. Animal ID and vaccine treatment group given below x-axis. nSFU, normalized spot forming units. Animals were considered to have responded if nSFU per million cells was ≥10 fold greater than baseline for PBMCs or ≥10 fold greater than mock vaccinated controls for liver lymphocytes and splenocytes.
