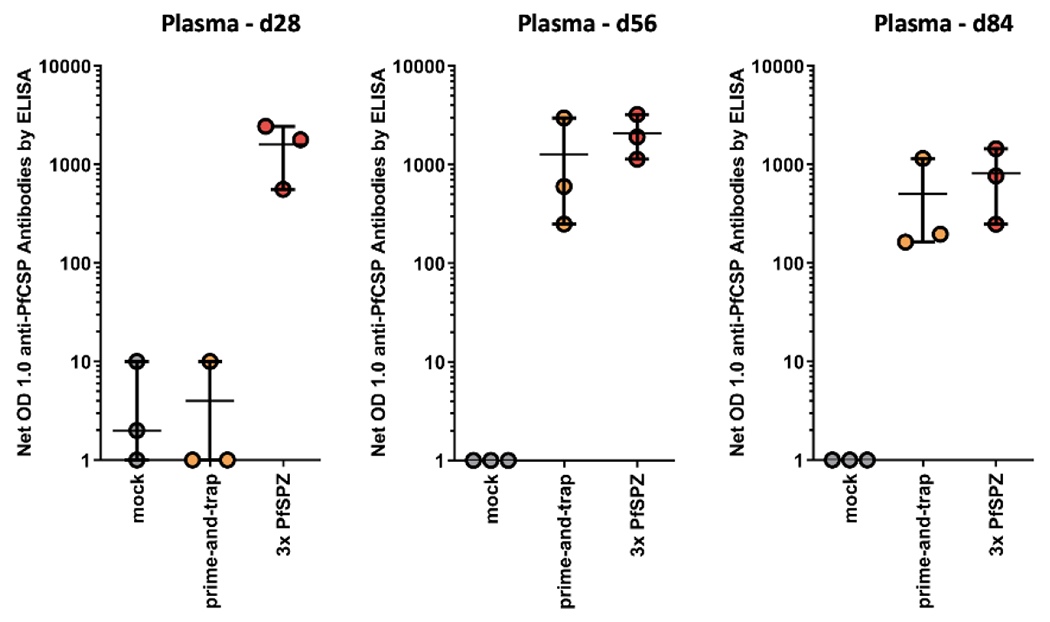
Figure 3. Humoral response to vaccination as measured by PfCSP ELISA.

Plasma was collected at baseline, on day 28 before final vaccination, and post-vaccination on day 56 and 84. The net OD 1.0 was calculated by subtracting the baseline OD 1.0 from the sample OD 1.0. Data for individual animals is shown as circles. Error bars show mean and range for each vaccine treatment group.
