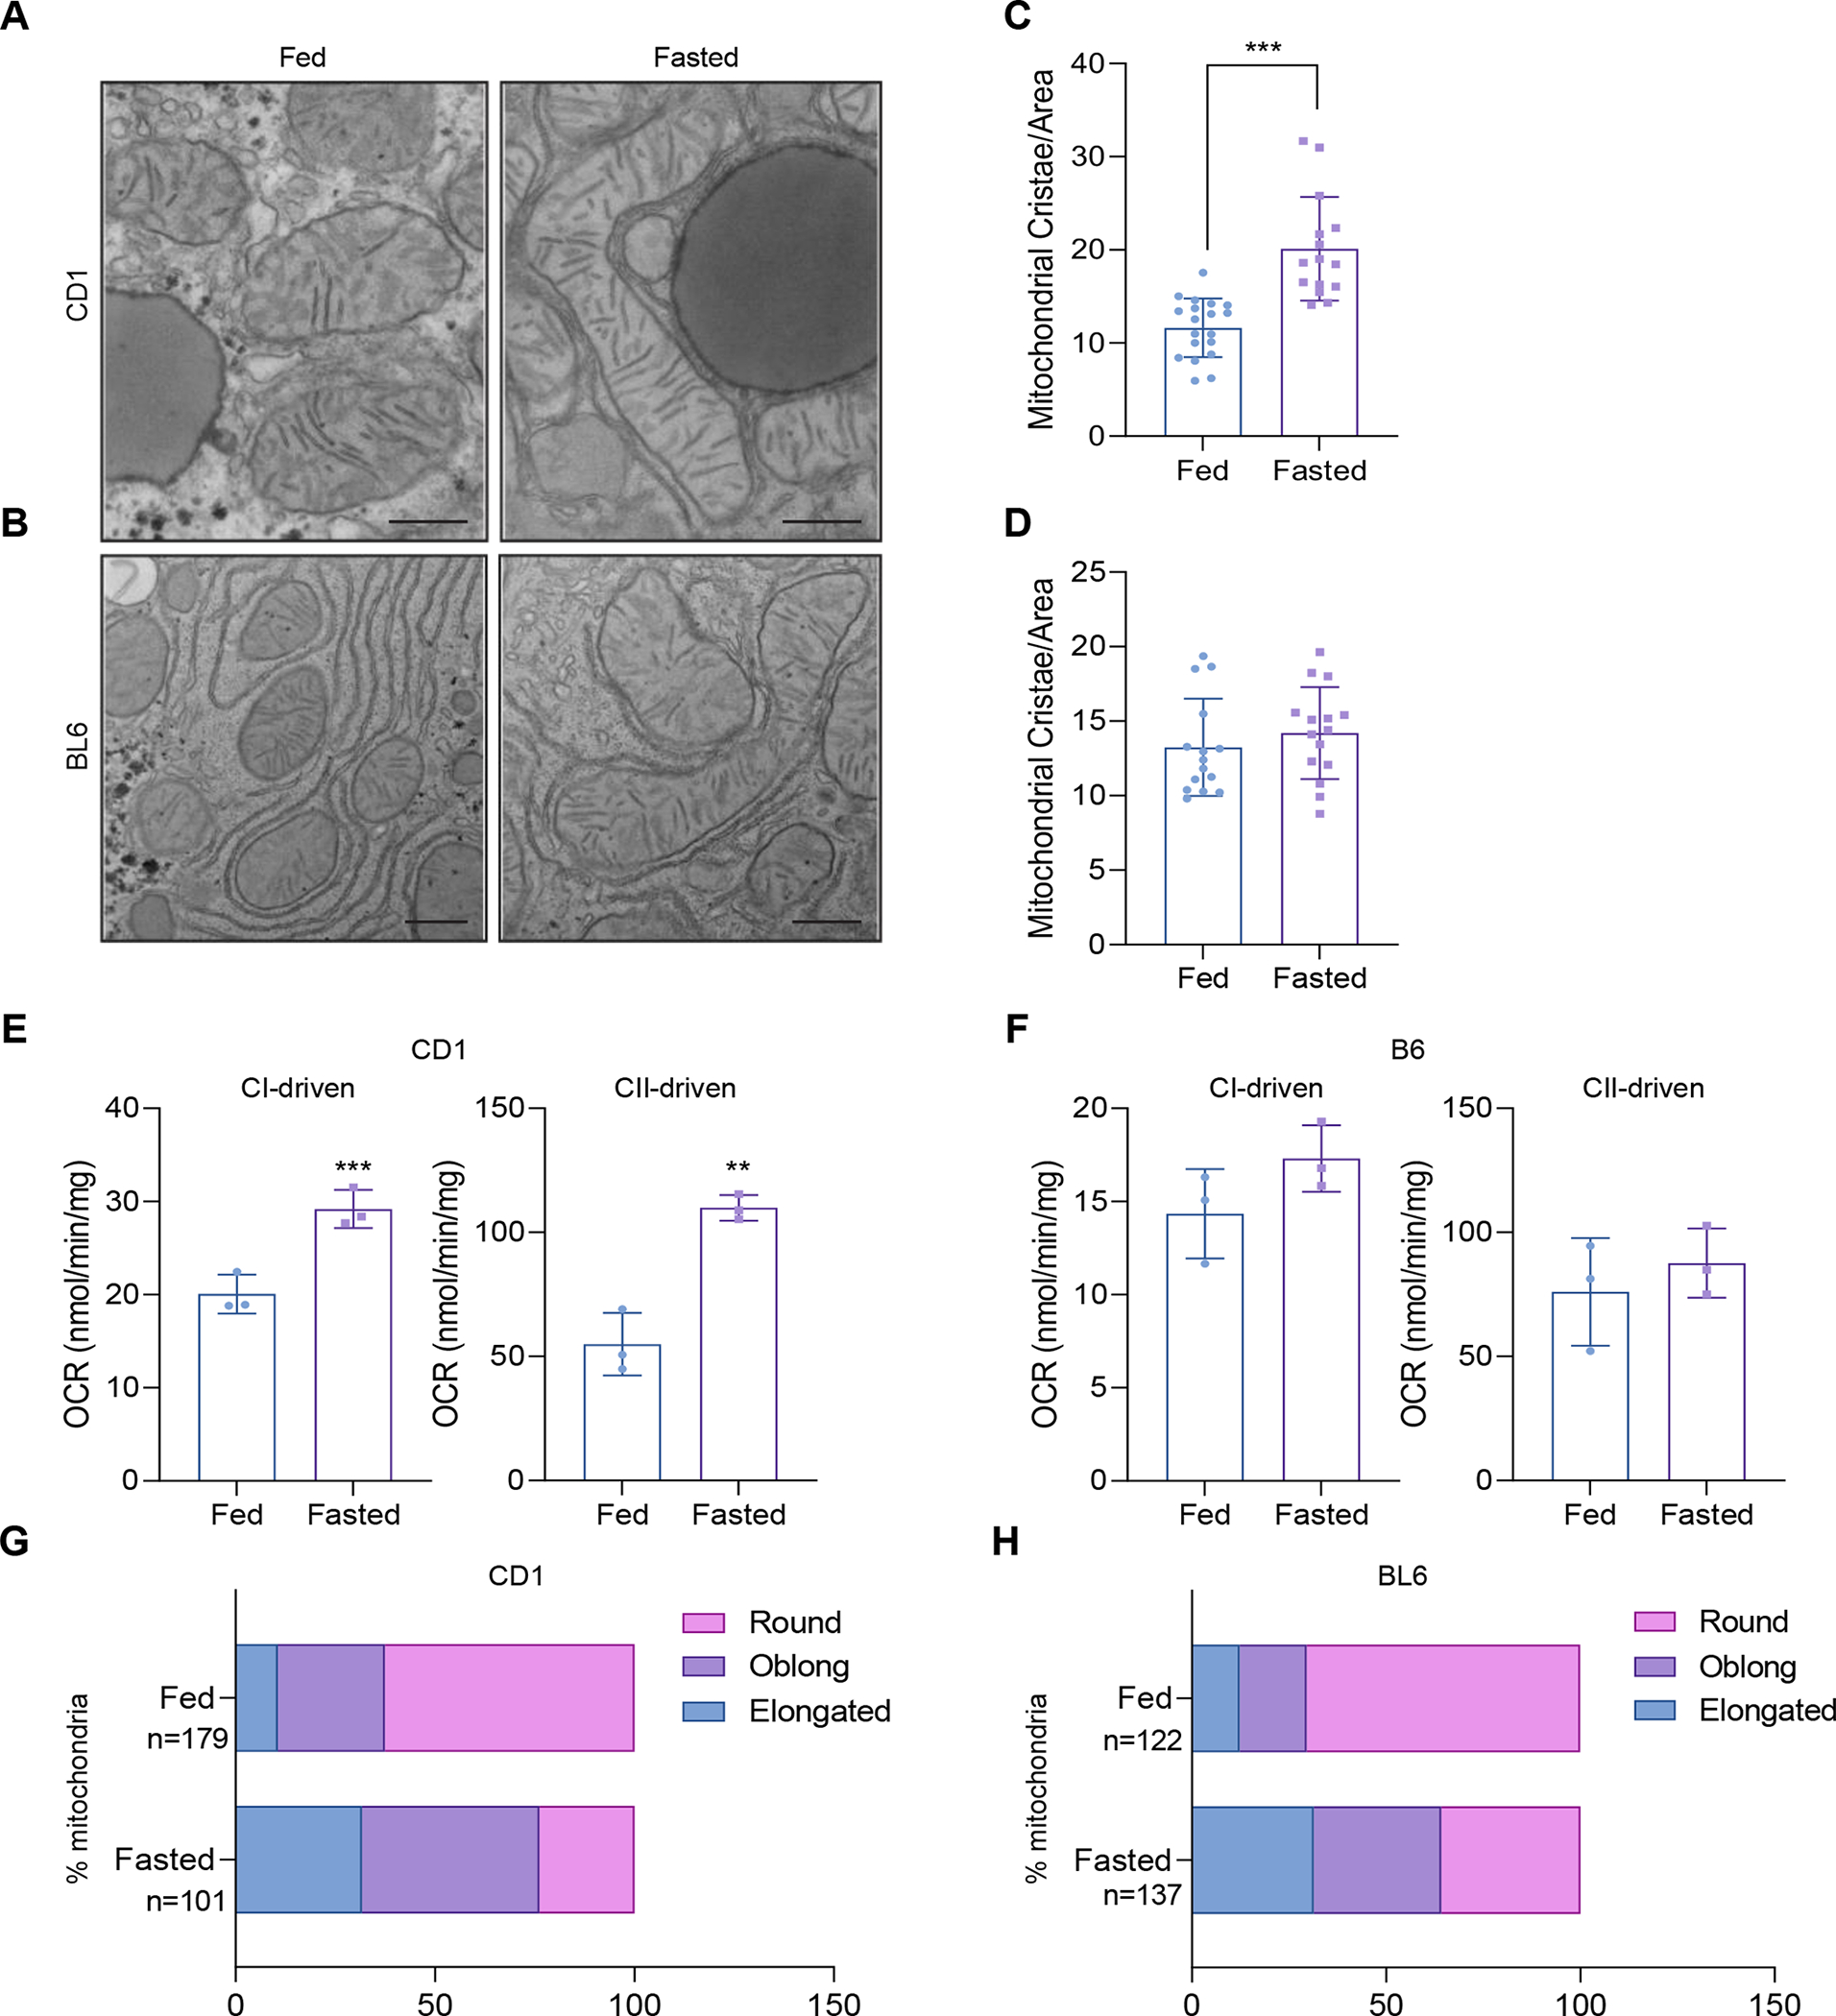
Figure 2. Fasting promotes mitochondrial cristae formation and mitochondrial respiration in CD-1 livers, but not BL6.

(A and B) Transmission Electron Microscopy (TEM) analysis of liver mitochondria in 24 hour fasted vs. ad libitum fed CD-1 and BL6 (n=2 mice, >5 section of images per animal).
(C and D) Number of mitochondrial cristae per mitochondrial area (a.u.) in fasted vs. fed animals in CD-1 and BL6 livers (n>14 mitochondria per group).
(E and F) Measurement of complex I- and complex II-linked oxygen consumption rate (OCR) in isolated liver mitochondria from fasted vs. fed CD-1 and BL6 (n=3).
(G and H) Percentage of mitochondria that are round, oblong, or elongated in fasted vs. fed animals in TEM images of CD-1 and BL6 mouse livers. Number of mitochondria analyzed are denoted in the figure.
Data represented as mean±SD (C-F). **p< 0.01, ***p< 0.001 by Student’s t-test (C-F). n represents the number of biological replicates.
