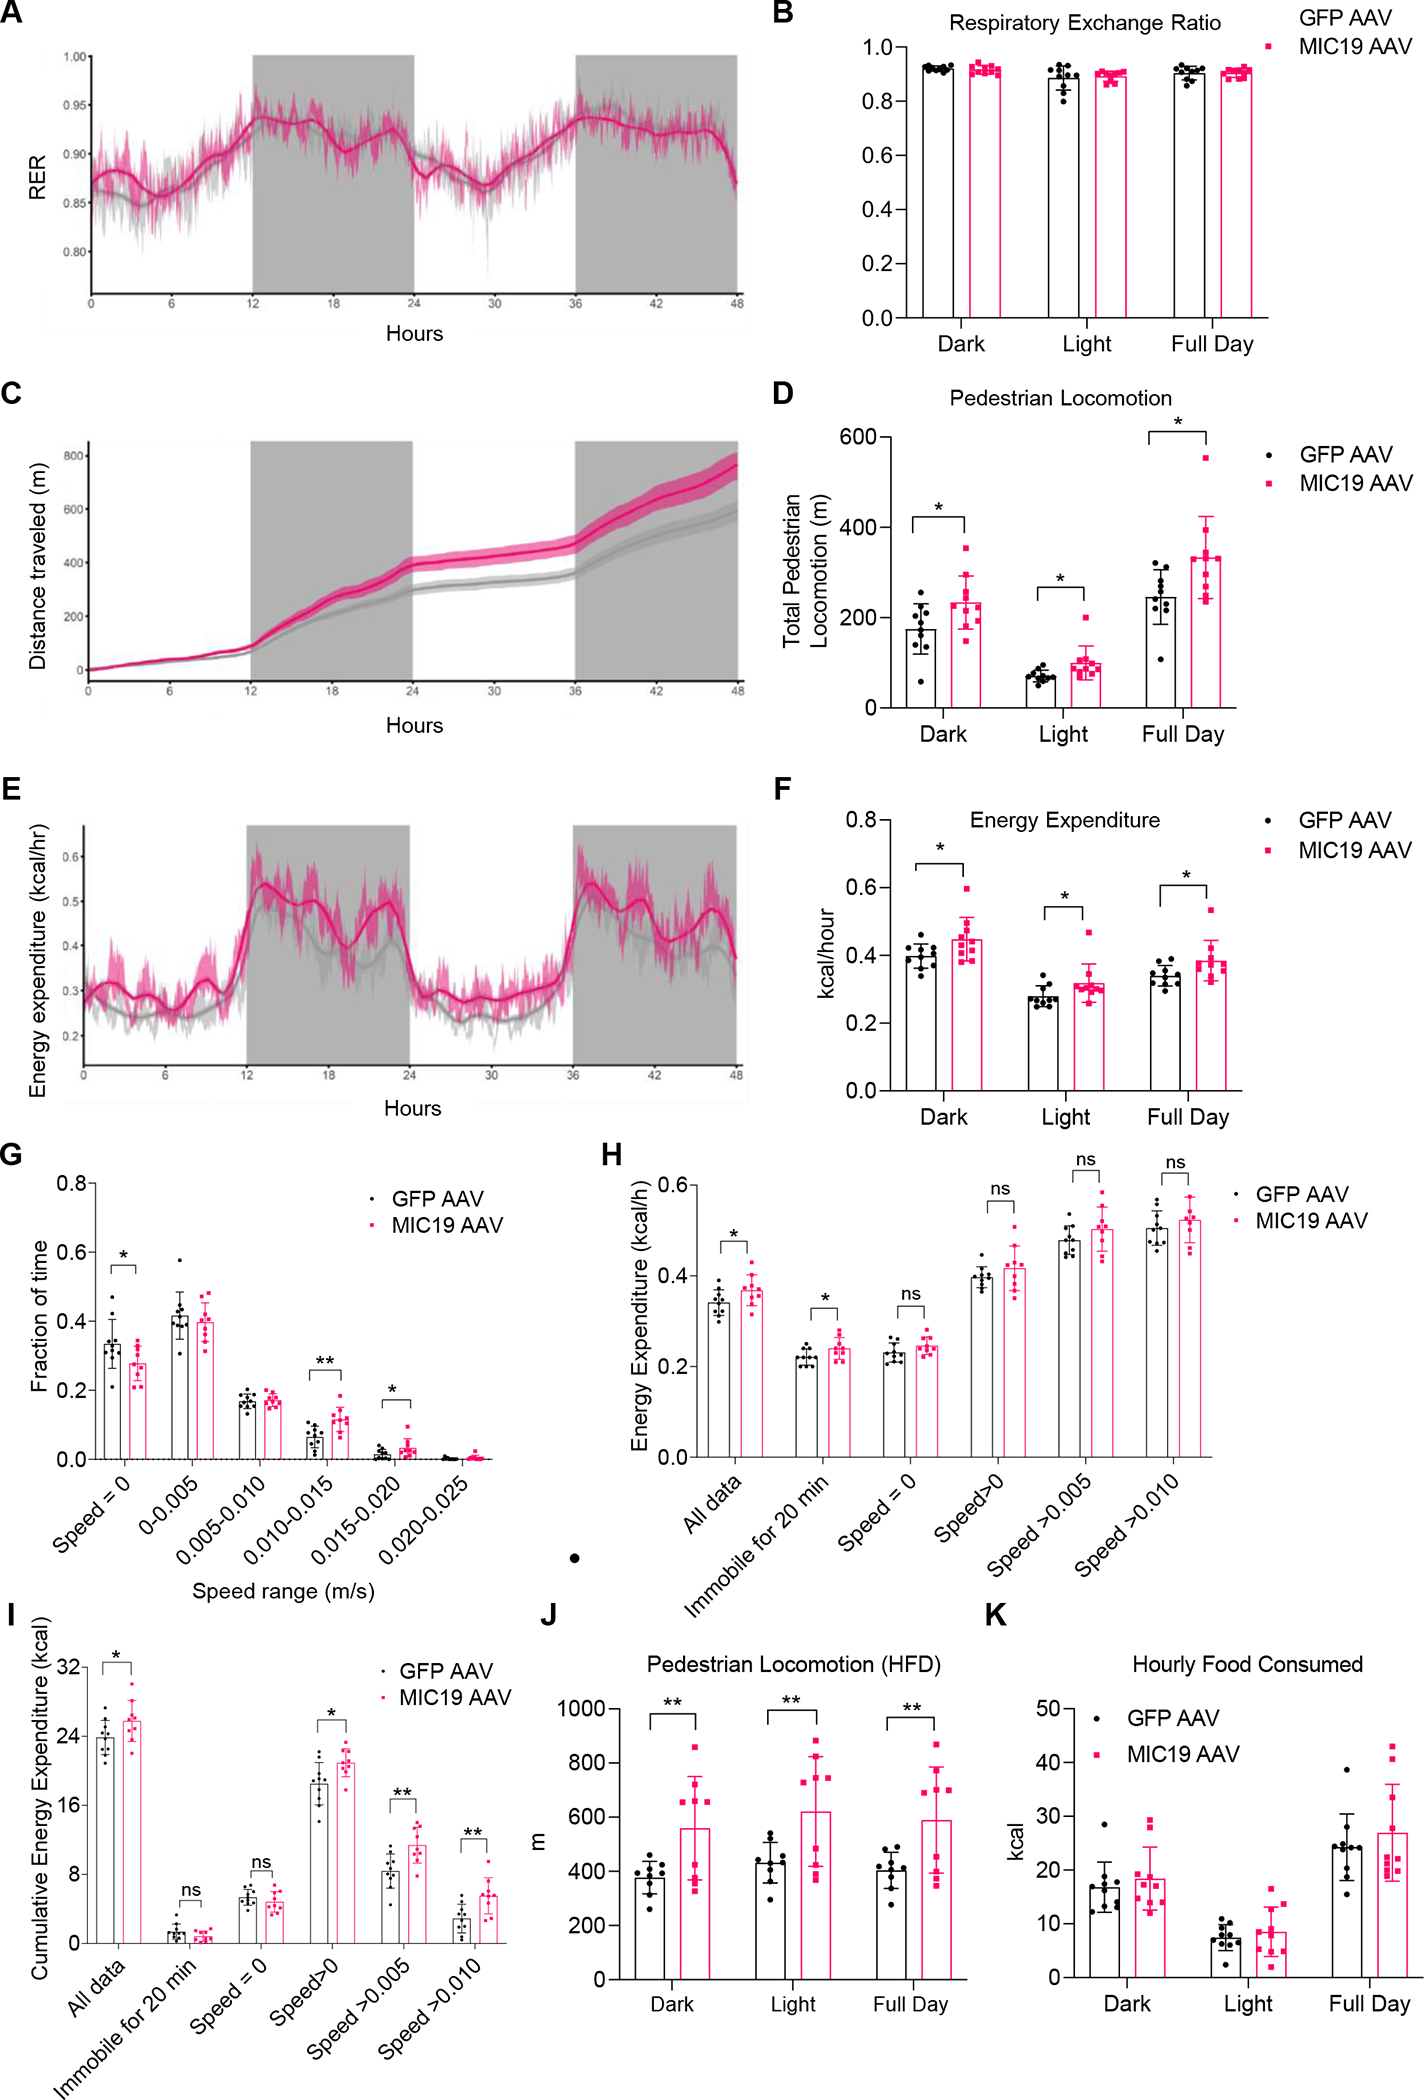
Figure 5. Animals that overexpress MIC19 in the liver have increased pedestrian locomotion.

Metabolic parameters across light and dark cycles for GFP vs. MIC19 AAV mice at 30°C.
(A-F) Respiratory Exchange Ratio (RER), cumulative pedestrian locomotion, and energy expenditure (n=10).
(G-I) Fraction of time spent at certain speeds, mean energy expenditure at certain speeds, and cumulative energy expenditure at certain speeds (m/s). n=10 for GFP and n=9 for MIC19 AAV mice.
(J) Pedestrian locomotion in GFP vs. MIC19 AAV mice with a body weight difference on an HFD (n=9).
(K) Hourly Food Consumed in kcal (n=10).
Data represented as mean±SD (B, D, F-K) or as mean±SEM (A, C, E). *p< 0.05, **p< 0.01 by Student’s t-test (B, D, F-K). n represents the number of biological replicates. See also Figure S4.
