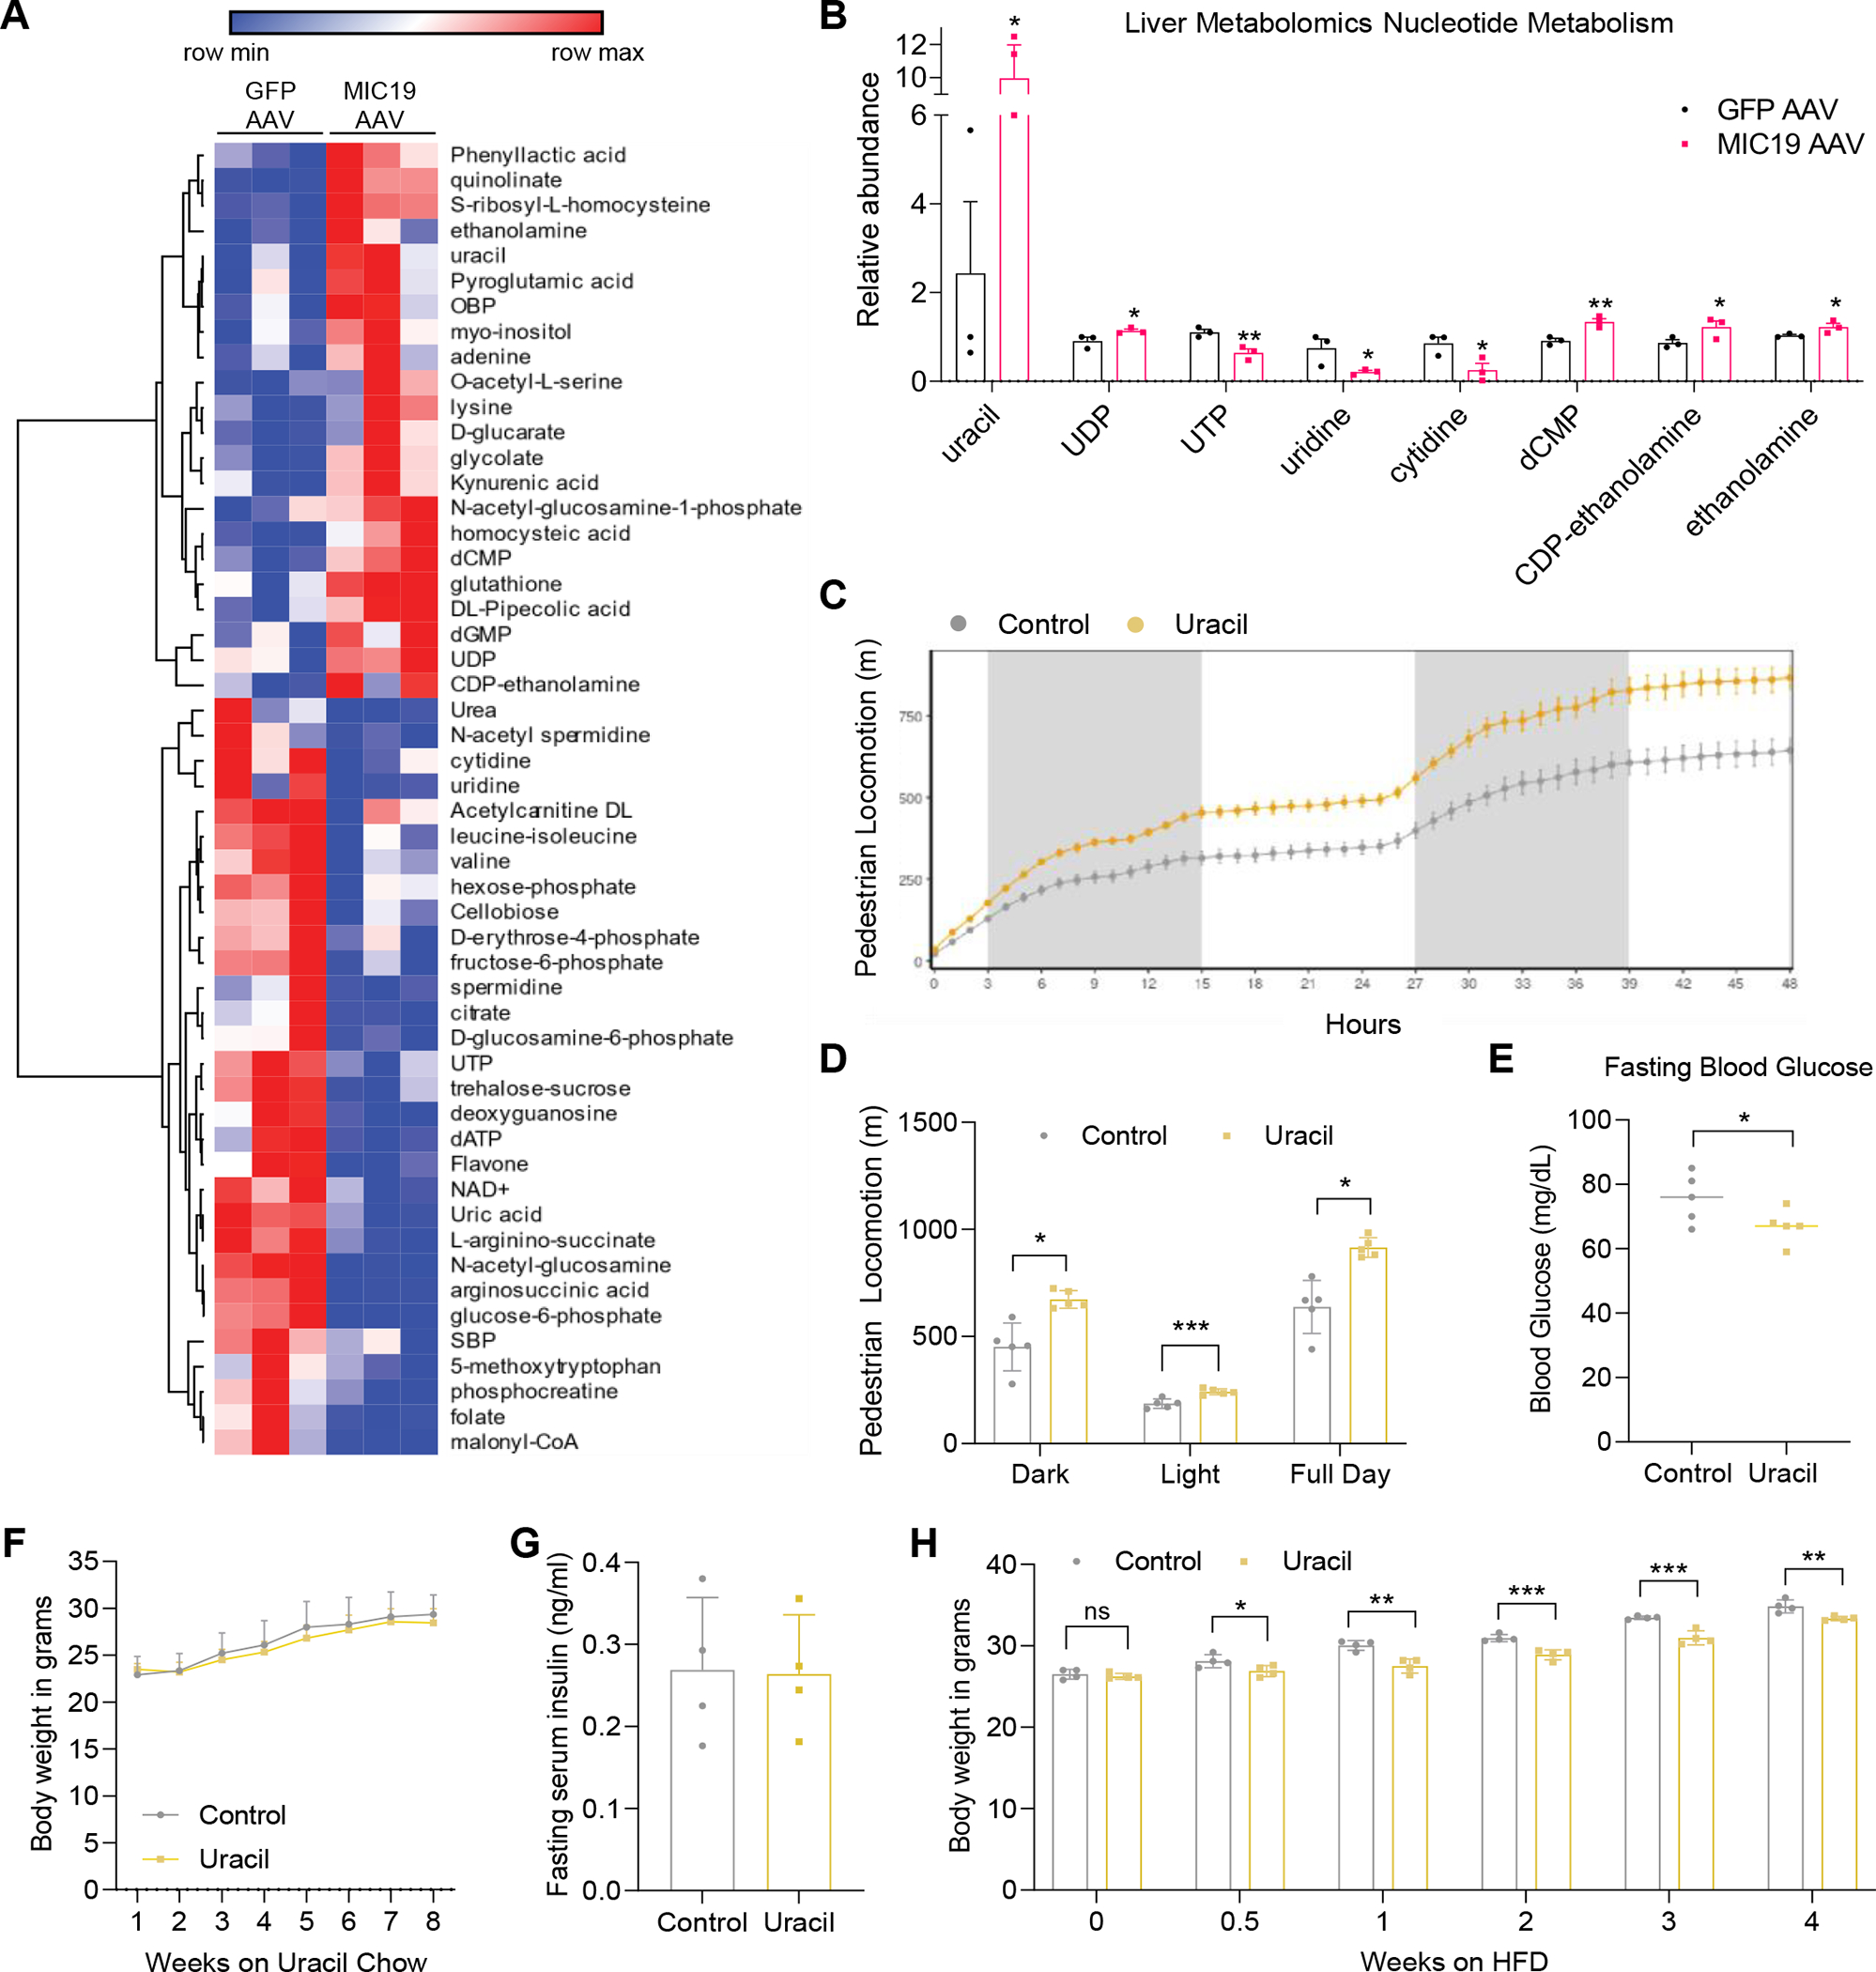
Figure 6. Uracil accumulates in MIC19 AAV livers and promotes locomotion.

(A) Heatmap showing metabolites that change significantly between GFP vs. MIC19 AAV livers (p<0.05, n=3).
(B) Relative abundance of pyrimidine nucleotides in GFP vs. MIC19 AAV livers.
(C and D) Pedestrian locomotion in mice supplemented with uracil (0.1% in drinking water, n=5).
(E-G) Fasting blood glucose, body weight, and fasting serum insulin level of mice on a standard chow diet with or without 1% uracil supplementation (n=4~5).
(H) Body weight of mice on an HFD supplemented with uracil (0.1% in drinking water, n=4).
Data represented as mean±SD (D-H) or as mean±SEM (B, C). *p< 0.05, **p< 0.01, ***p< 0.001 by Student’s t-test (A, B, D-H). n represents the number of biological replicates. See also Figure S5.
