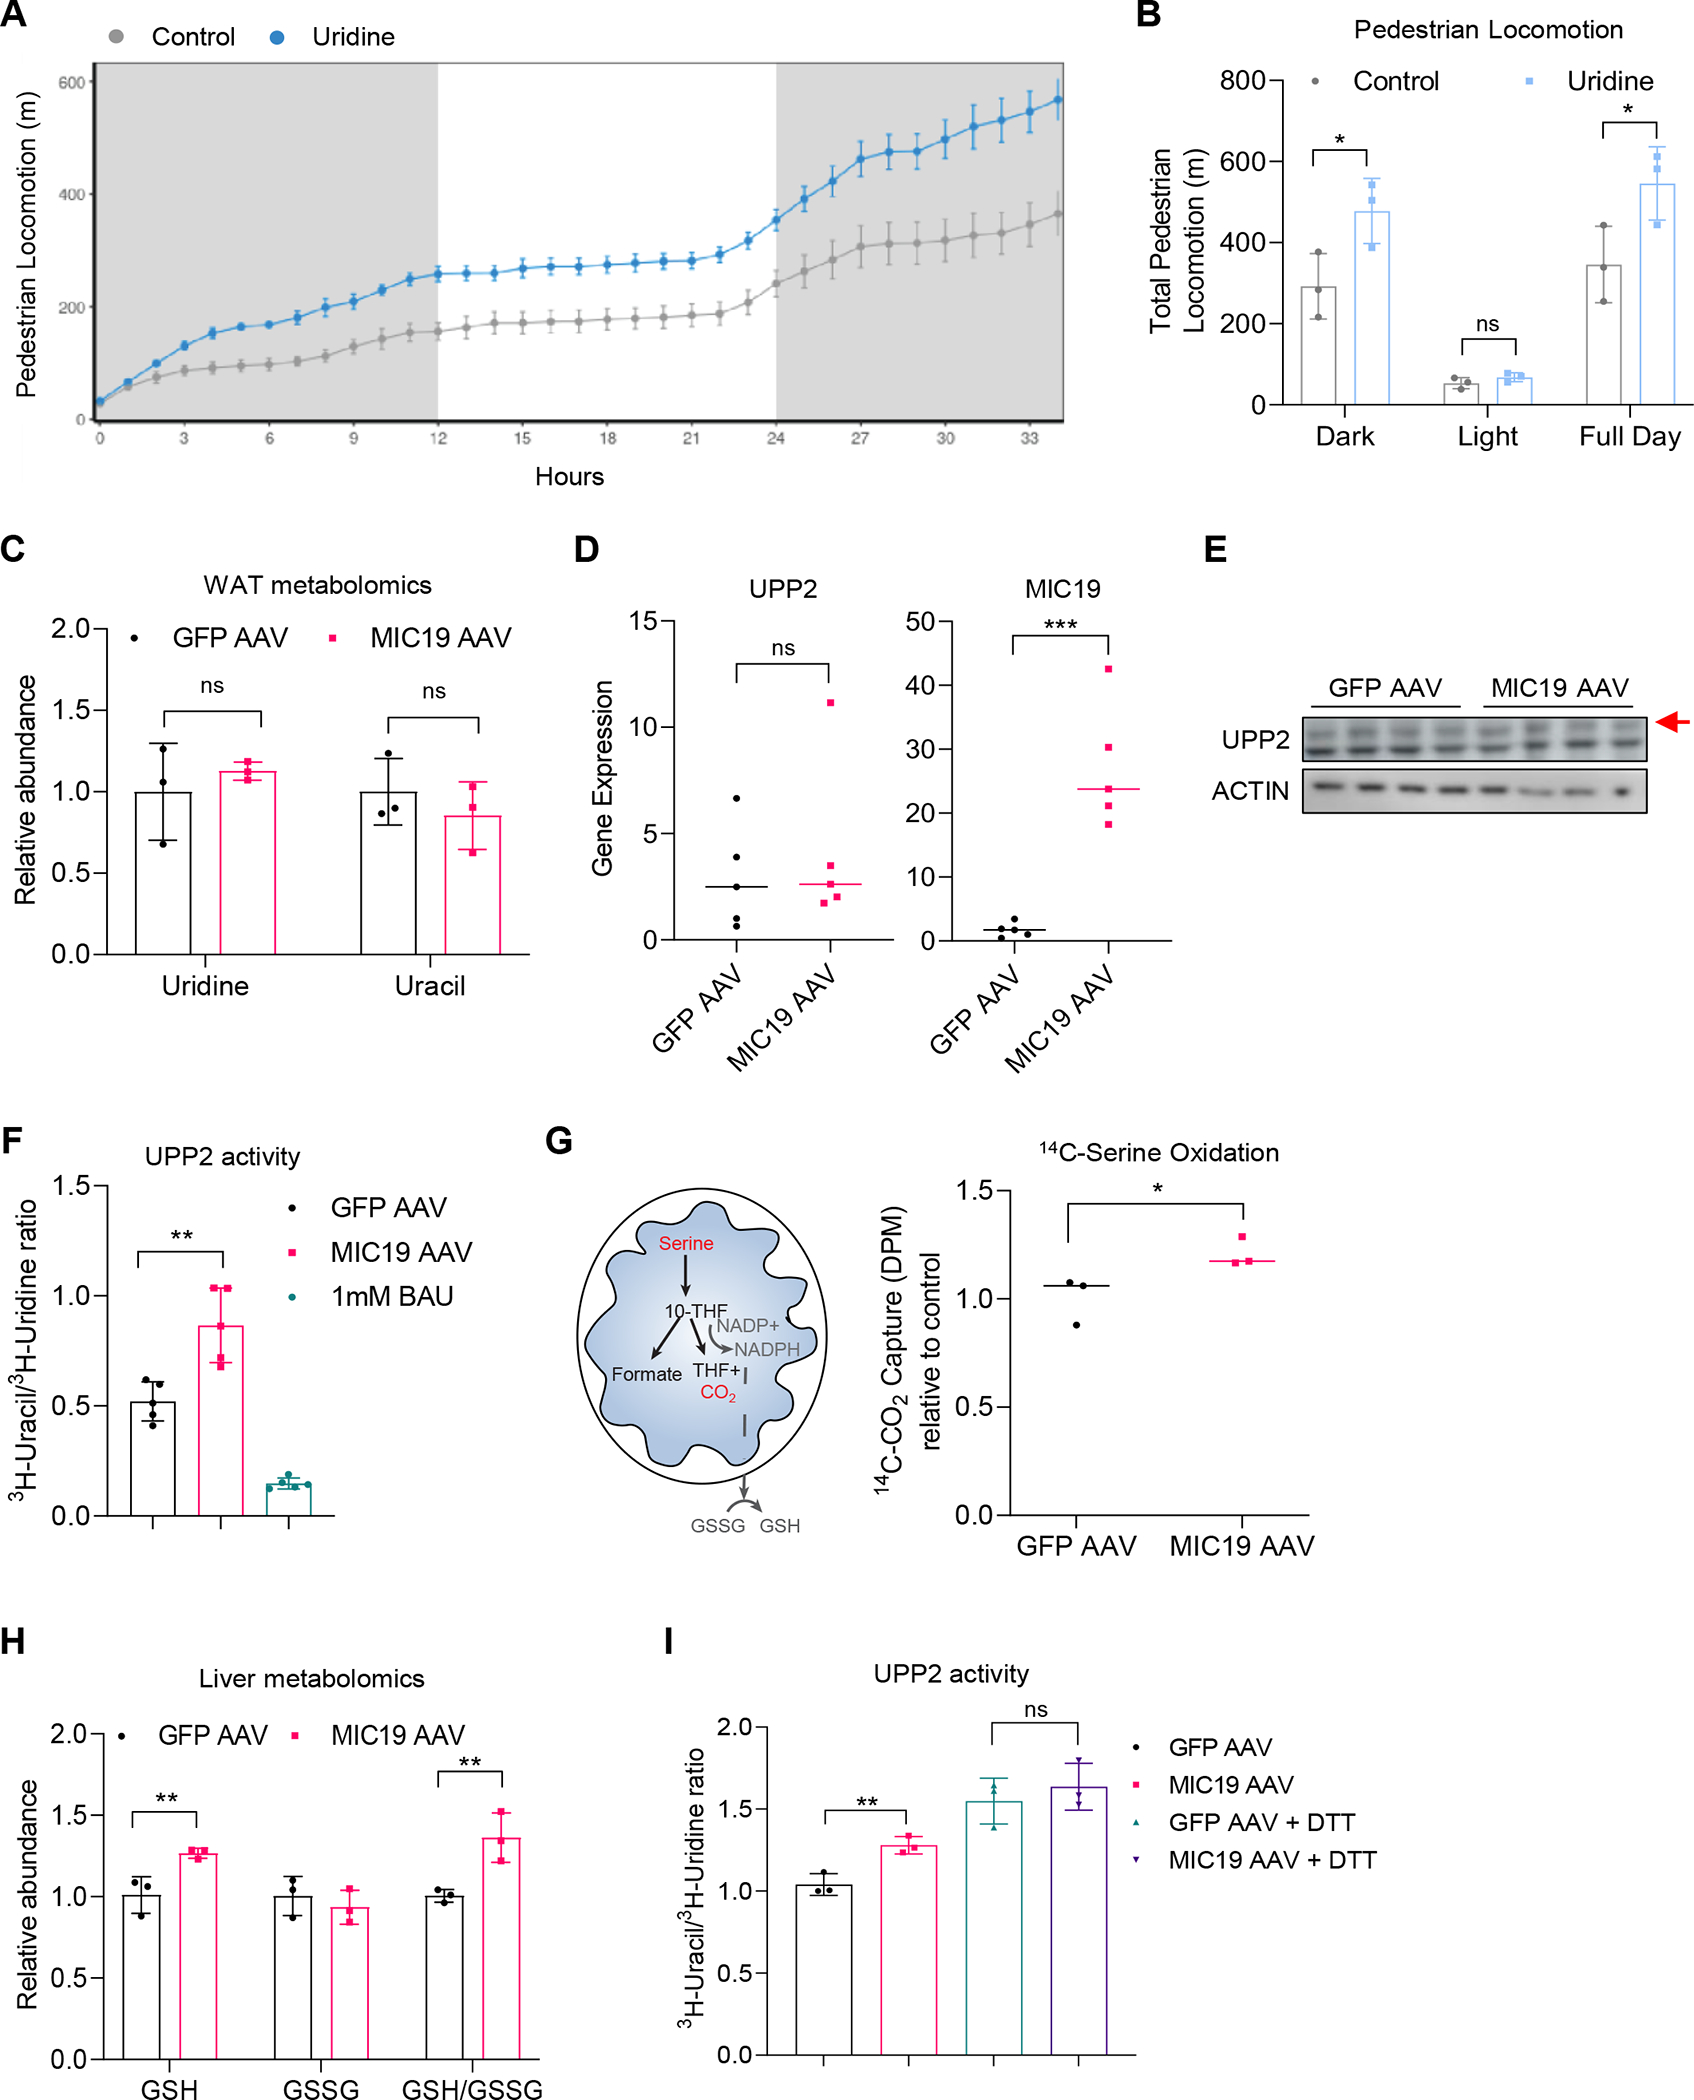
Figure 7. Conversion of uridine to uracil is increased in MIC19 AAV animals in a redox sensitive manner.

(A and B) Pedestrian locomotion in mice supplemented with uridine (3% drinking water, n=3 mice).
(C) Relative abundance of uridine and uracil in iWAT in GFP vs. MIC19 AAV mice from a metabolomics experiment (n=3).
(D) UPP2 and MIC19 mRNA expression levels in GFP vs. MIC19 AAV livers (n=5).
(E) Western blots showing UPP2 protein levels in GFP vs. MIC19 AAV livers. Red arrow denotes the size for UPP2.
(F) Ratio of 3H-uracil to 3H-uridine as a measure for UPP2 activity in GFP vs. MIC19 AAV liver lysates. Treatment of GFP AAV lysates with 1 mM BAU inhibits UPP2 activity (n=5).
(G) Left: Cartoon depicting the oxidation of serine through the mitochondrial one carbon pathway and its connection to glutathione. Right: 14C-serine oxidation in liver homogenates from GFP vs. MIC19 AAV livers normalized to CSA, shown relative to GFP AAV (n=3).
(H) Reduced and oxidized glutathione levels in GFP vs. MIC19 AAV livers (n=3). (I) UPP2 activity in GFP vs. MIC19 AAV liver lysates with or without 10 mM DTT treatment (n=3).
Data represented as mean±SD (B, C, F, H, I) or as mean±SEM (A). *p< 0.05, **p< 0.01, ***p< 0.001 by Student’s t-test (B-D, F-I). n represents the number of biological replicates. See also Figure S6.
