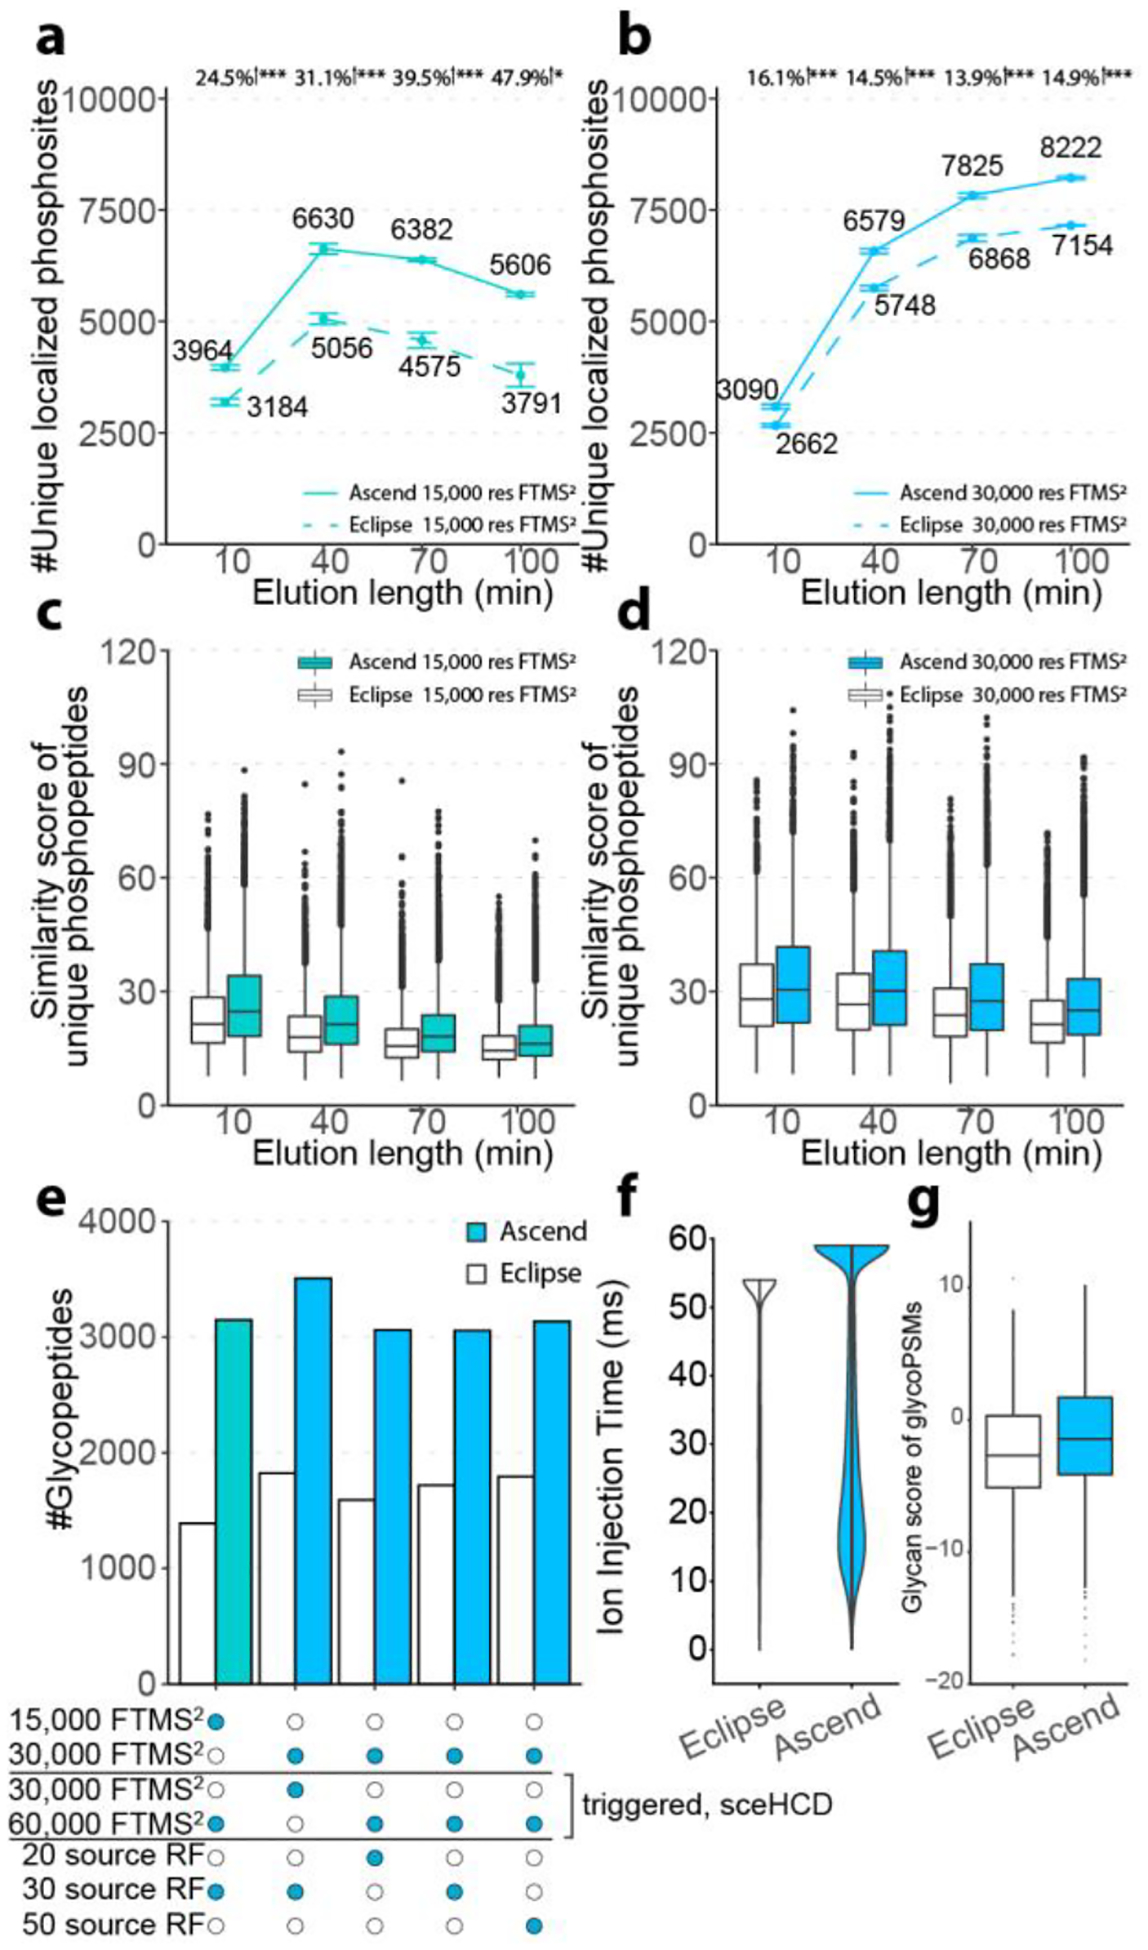
Figure 3. Phosphoproteomics and glycoproteomics comparing Orbitrap Ascend and Orbitrap Eclipse.

The number of unique localized phosphosites detected over a range of elution lengths by (a) 15,000 res FTMS2 and (b) 30,000 res FTMS2. Student’s t-tests were performed to calculate p values for comparison between the two instruments. *, p < 0.05. **, p < 0.01. ***, p < 0.001. Error bars represented one standard deviation of uncertainty. n=3 for elution length of 10 to 70 and n=2 for elution length of 100. Hyper score of unique phosphopeptides detected over a range of elution lengths by (c) 15,000 res FTMS2 and (d) 30,000 res FTMS2. (e) The number of glycopeptides identified by various 70 min data acquisition methods. (f) MS2 ion injection times of 30,000 res FTMS2/sceHCD 30,000 res FTMS2 method. (g) Glycan scores, as reported by MSFragger - Glyco, of 30,000 res FTMS2/sceHCD 30,000 res FTMS2 method.
