
Fig. 2. Cellular allostatic load is associated with hypermetabolism.
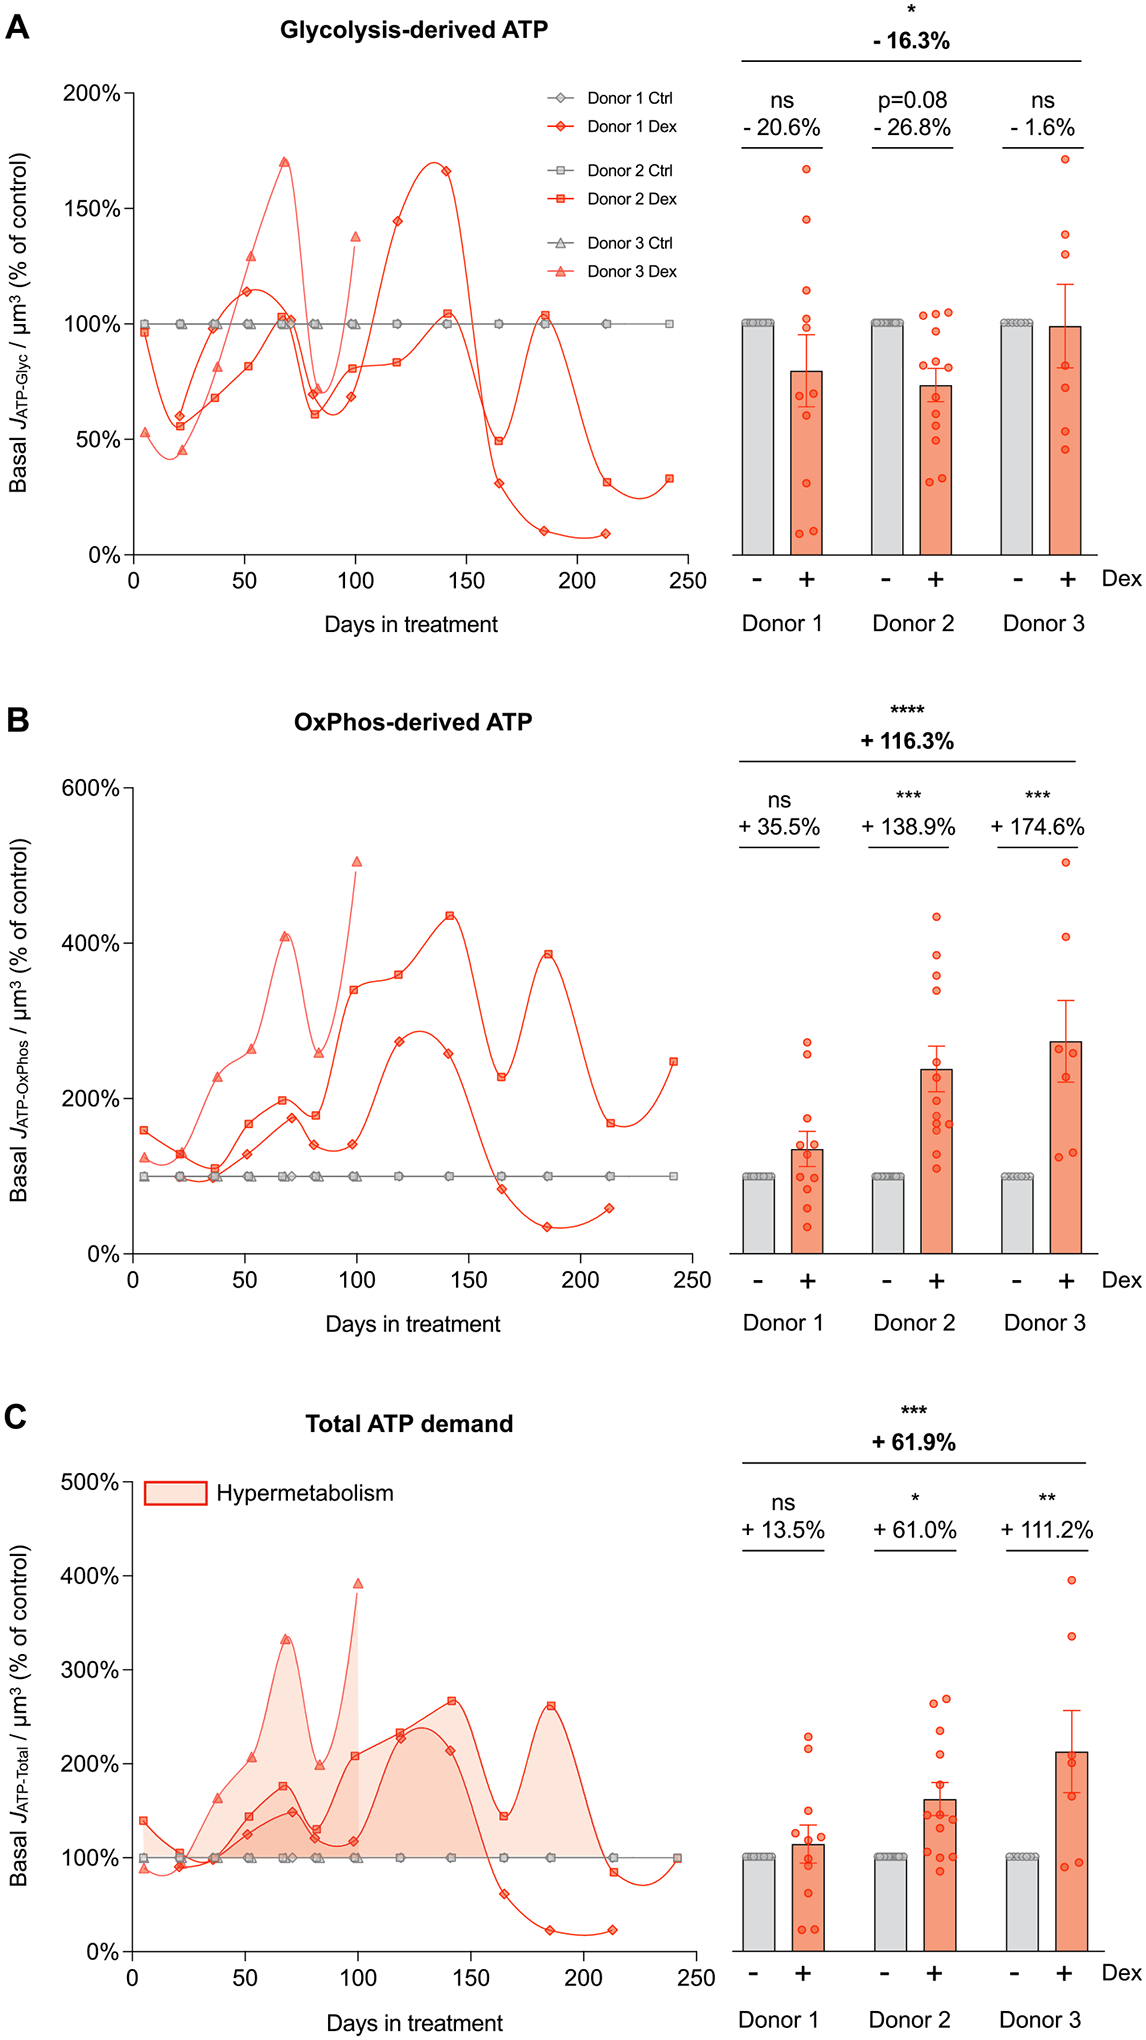
(A-C) Energy expenditure trajectories across the cellular lifespan derived from Seahorse extracellular flux analyzer described in detail in Supplementary Material Fig. S1. (A) Lifespan trajectories (left panel) and lifespan average effects (right panel) of Dex treatment expressed relative to the corresponding control time points for each donor on basal glycolysis-derived ATP (JATP-Glyc), (B) OxPhos-derived ATP (JATP-OxPhos), and (C) total ATP production (JATP-Total) corrected for cell volume. n = 3 donors per group, 8–13 timepoints per donor. Lifespan average graphs are mean ± SEM, two-way ANOVA * p < 0.05, * * p < 0.01, * ** p < 0.001, * ** * p < 0.0001, ns: not significant. JATP-Total is the algebraic sum of JATP-Glyc and JATP-OxPhos.