
Fig. 3. Cellular allostatic load involves a metabolic shift towards OxPhos.
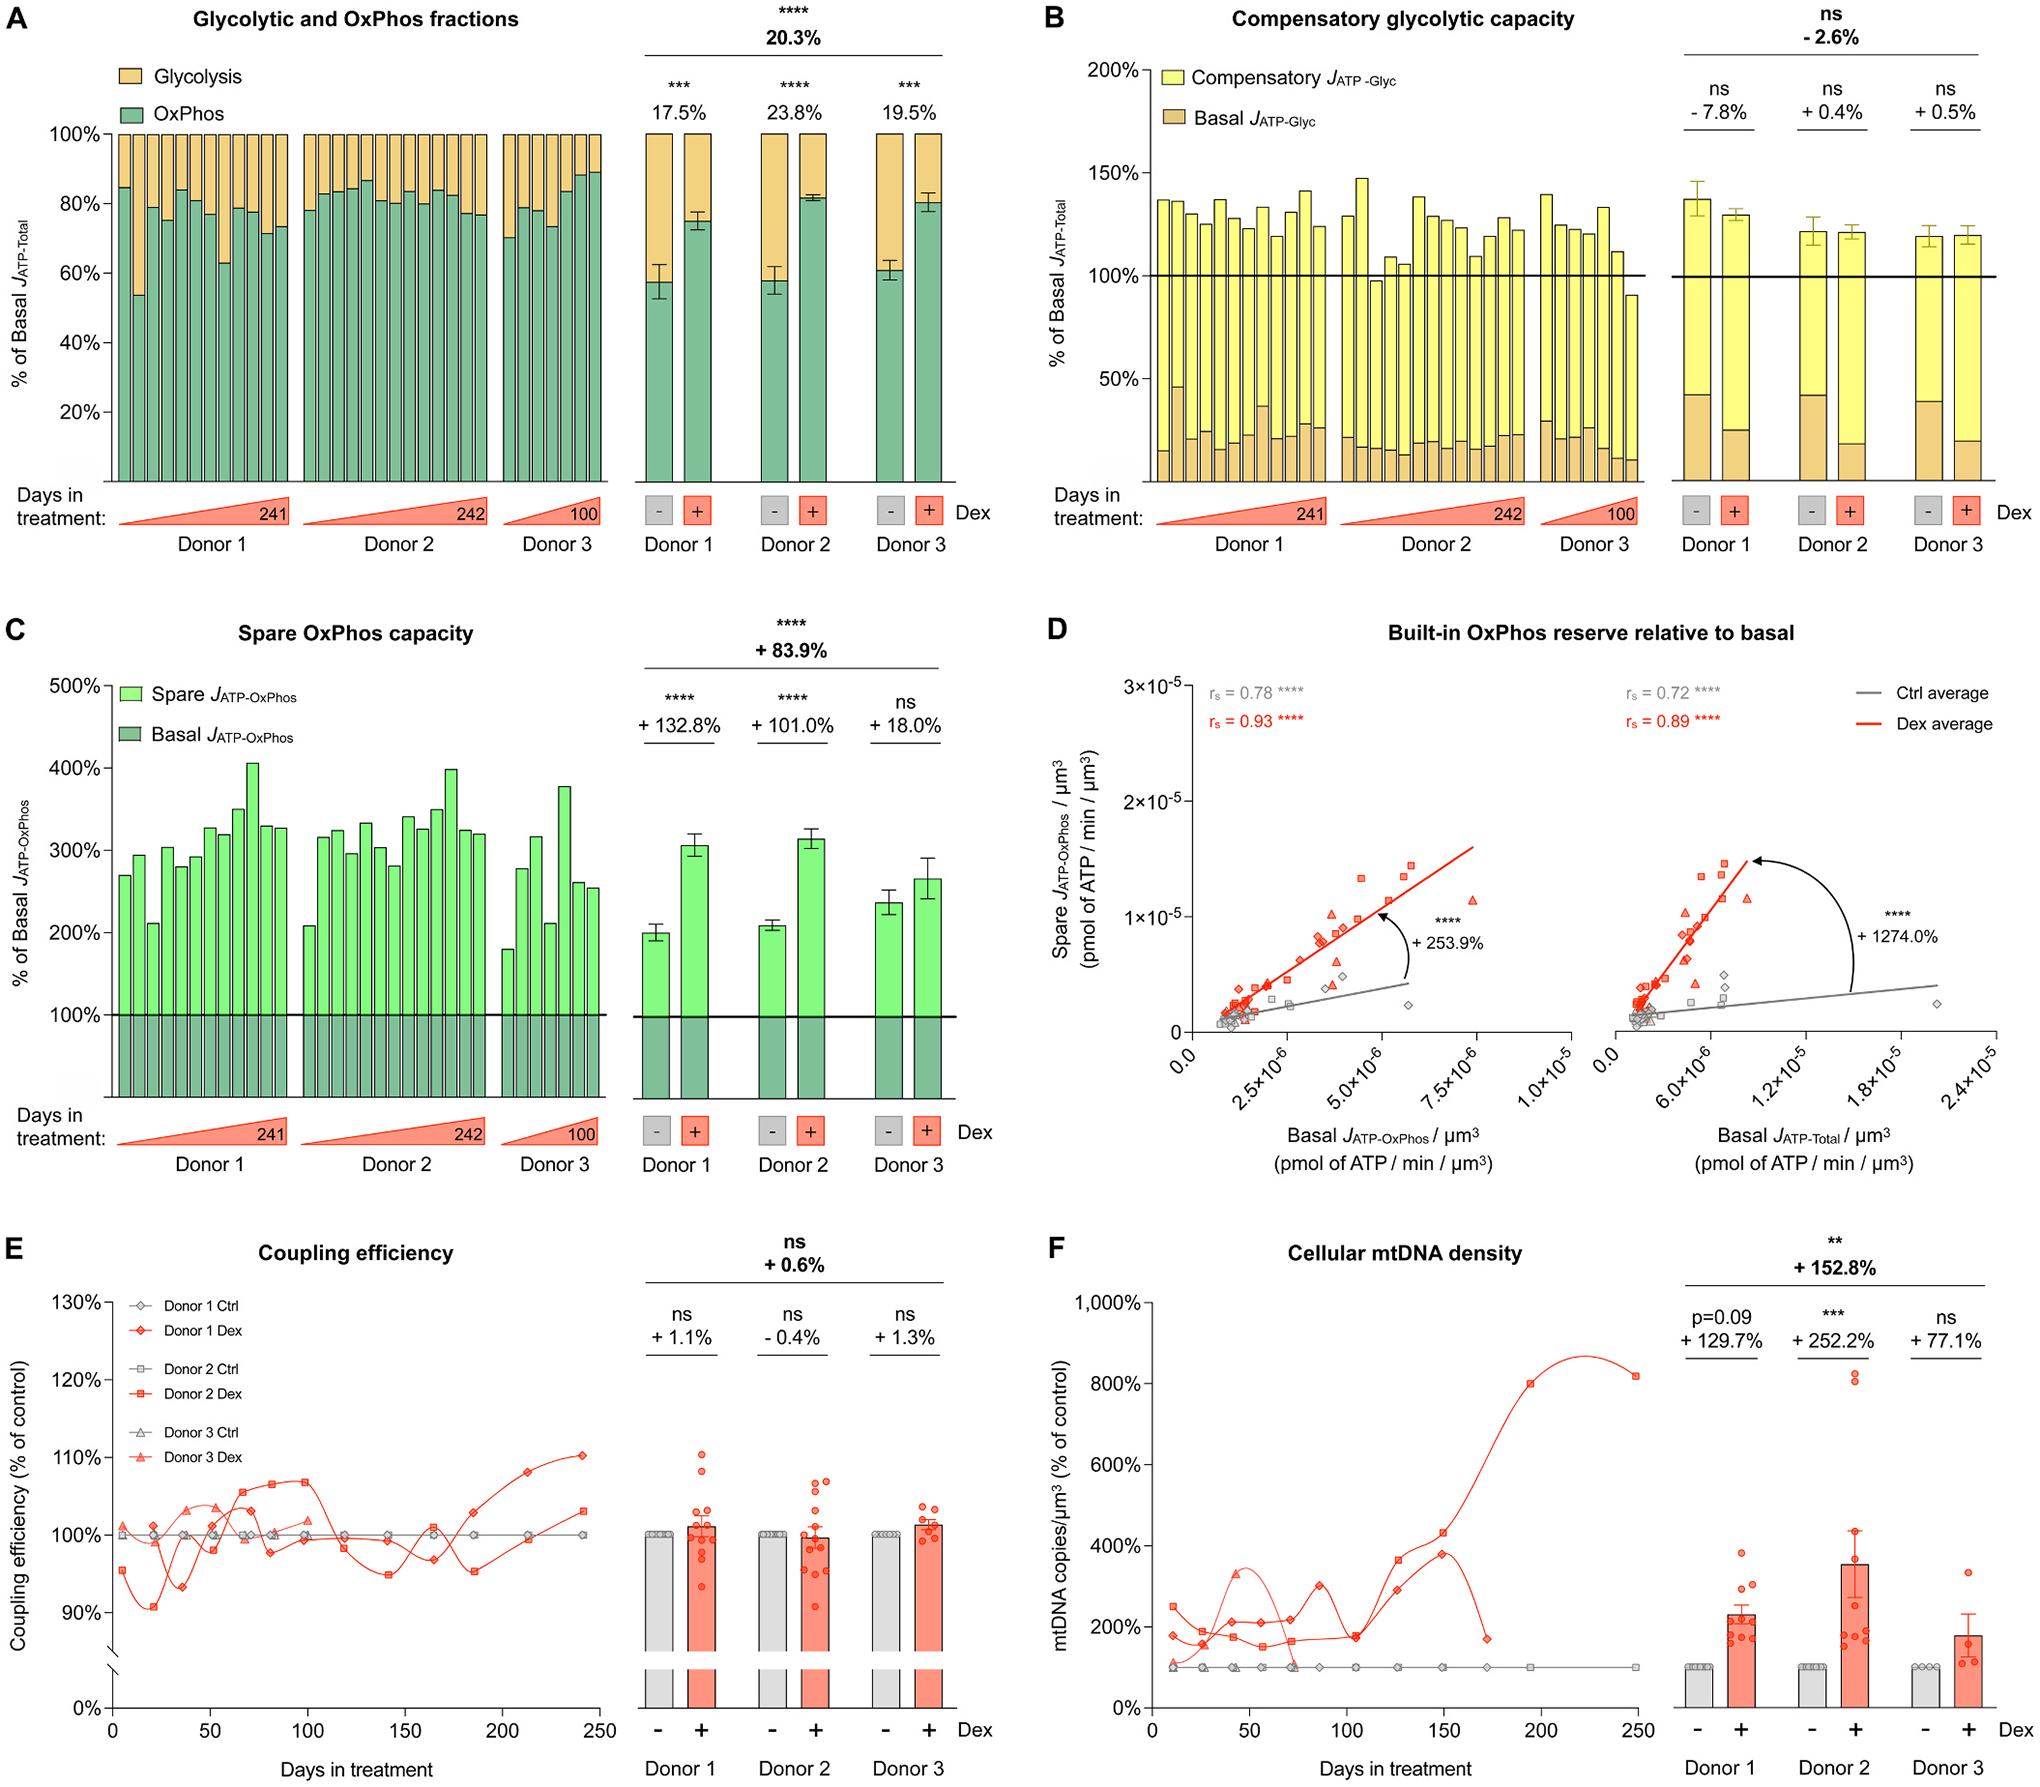
(A) Fraction of basal energy production from JATP-Glyc (yellow) and basal JATP-OxPhos (green) across the lifespan. (B) Compensatory glycolytic capacity, expressed as the percentage of basal JATP-Total, achieved when OxPhos ATP production is inhibited with oligomycin. Basal JATP-Glyc levels are shown in dark yellow, and compensatory JATP-Glyc are shown in bright yellow. (C) Same as B but for spare OxPhos capacity, expressed as the percentage of basal JATP-OxPhos that can be achieved under uncoupled condition with FCCP. Basal JATP-OxPhos levels are shown in dark green, and spare JATP-OxPhos are shown in bright green. (D) Correlation between spare JATP-OxPhos/cell volume and basal JATP-OxPhos/cell volume (left panel) and between spare JATP-OxPhos/cell volume and basal JATP-Total/cell volume (right panel). (E) Lifespan trajectories (left panel) and lifespan average effects (right panel) of Dex treatment on coupling efficiency expressed relative to the corresponding control time points for each donor. (F) Same as C but for mtDNA copy number/cell volume. n = 3 donors per group, 8–13 timepoints per donor. Lifespan average graphs are mean ± SEM, two-way ANOVA. Correlation graphs show Spearman r and thick lines represent simple linear regression for each group. * * p < 0.01, * ** p < 0.001, * ** * p < 0.0001, ns: not significant. JATP-Glyc: ATP production rate derived from glycolysis. JATP-OxPhos: ATP production rate derived from OxPhos. JATP-Total: algebraic sum of JATP-Glyc and JATP-OxPhos.