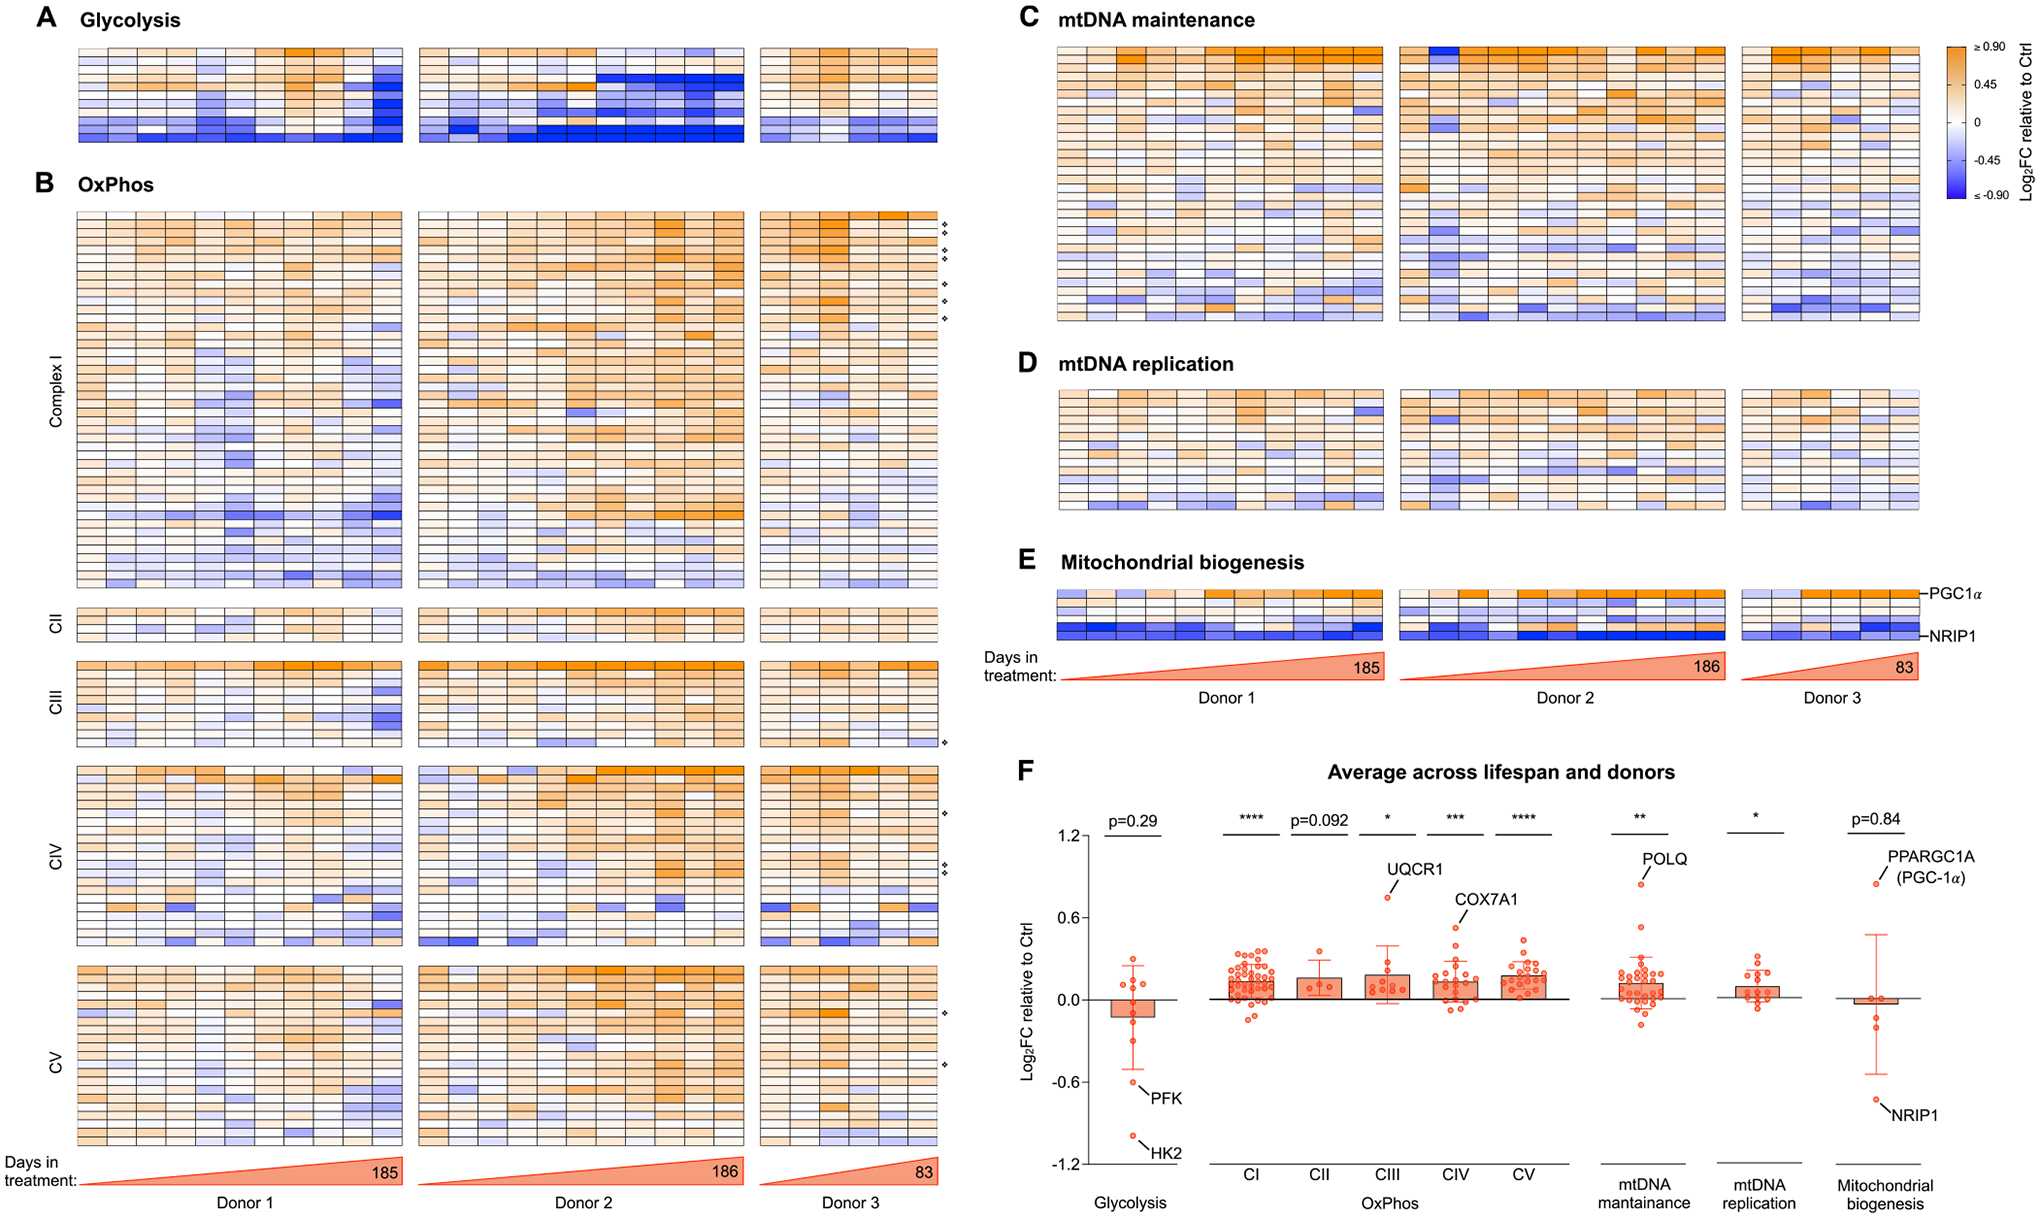
Fig. 4. Cellular allostatic load involves transcriptional upregulation of OxPhos and mitochondrial biogenesis.

(A) Heatmaps showing the effect of Dex treatment on the expression of glycolytic genes, expressed as the Log2 of fold change (Log2FC) of normalized gene expression relative to the corresponding control time points for each donor. (B) Same as A but for genes encoding the subunits of complexes I, II, III, IV and V of the OxPhos system, with mitochondrial-encoded genes marked with ❖ (C-E). Same as A and B but for genes encoding proteins associated with (C) mtDNA maintenance, (D) mtDNA replication, and (E) mitochondrial biogenesis. Two key regulators of mitochondrial biogenesis, one positive (PGC-1a) and one negative (NRIP1) are highlighted, showing expression signatures consistent with both activated and un-repressed mitochondrial biogenesis. (F) Average effect of Dex treatment shown in A-E. Each datapoint represents the gene average of the Log2FC values throughout the entire lifespan of the three donors (n = 28 timepoints). Average graphs are mean ± SEM, with each gene shown as a single datapoint. One-sample t-test different than 0, * p < 0.05, * * p < 0.01, * ** p < 0.001, * ** * p < 0.0001, ns: not significant. n = 3 donors per group, 9–10 timepoints per donor. Heatmap row annotation with individual gene names is provided in Supplementary Material Fig. S4.
