
Fig. 7. Cellular allostatic load causes mtDNA instability.
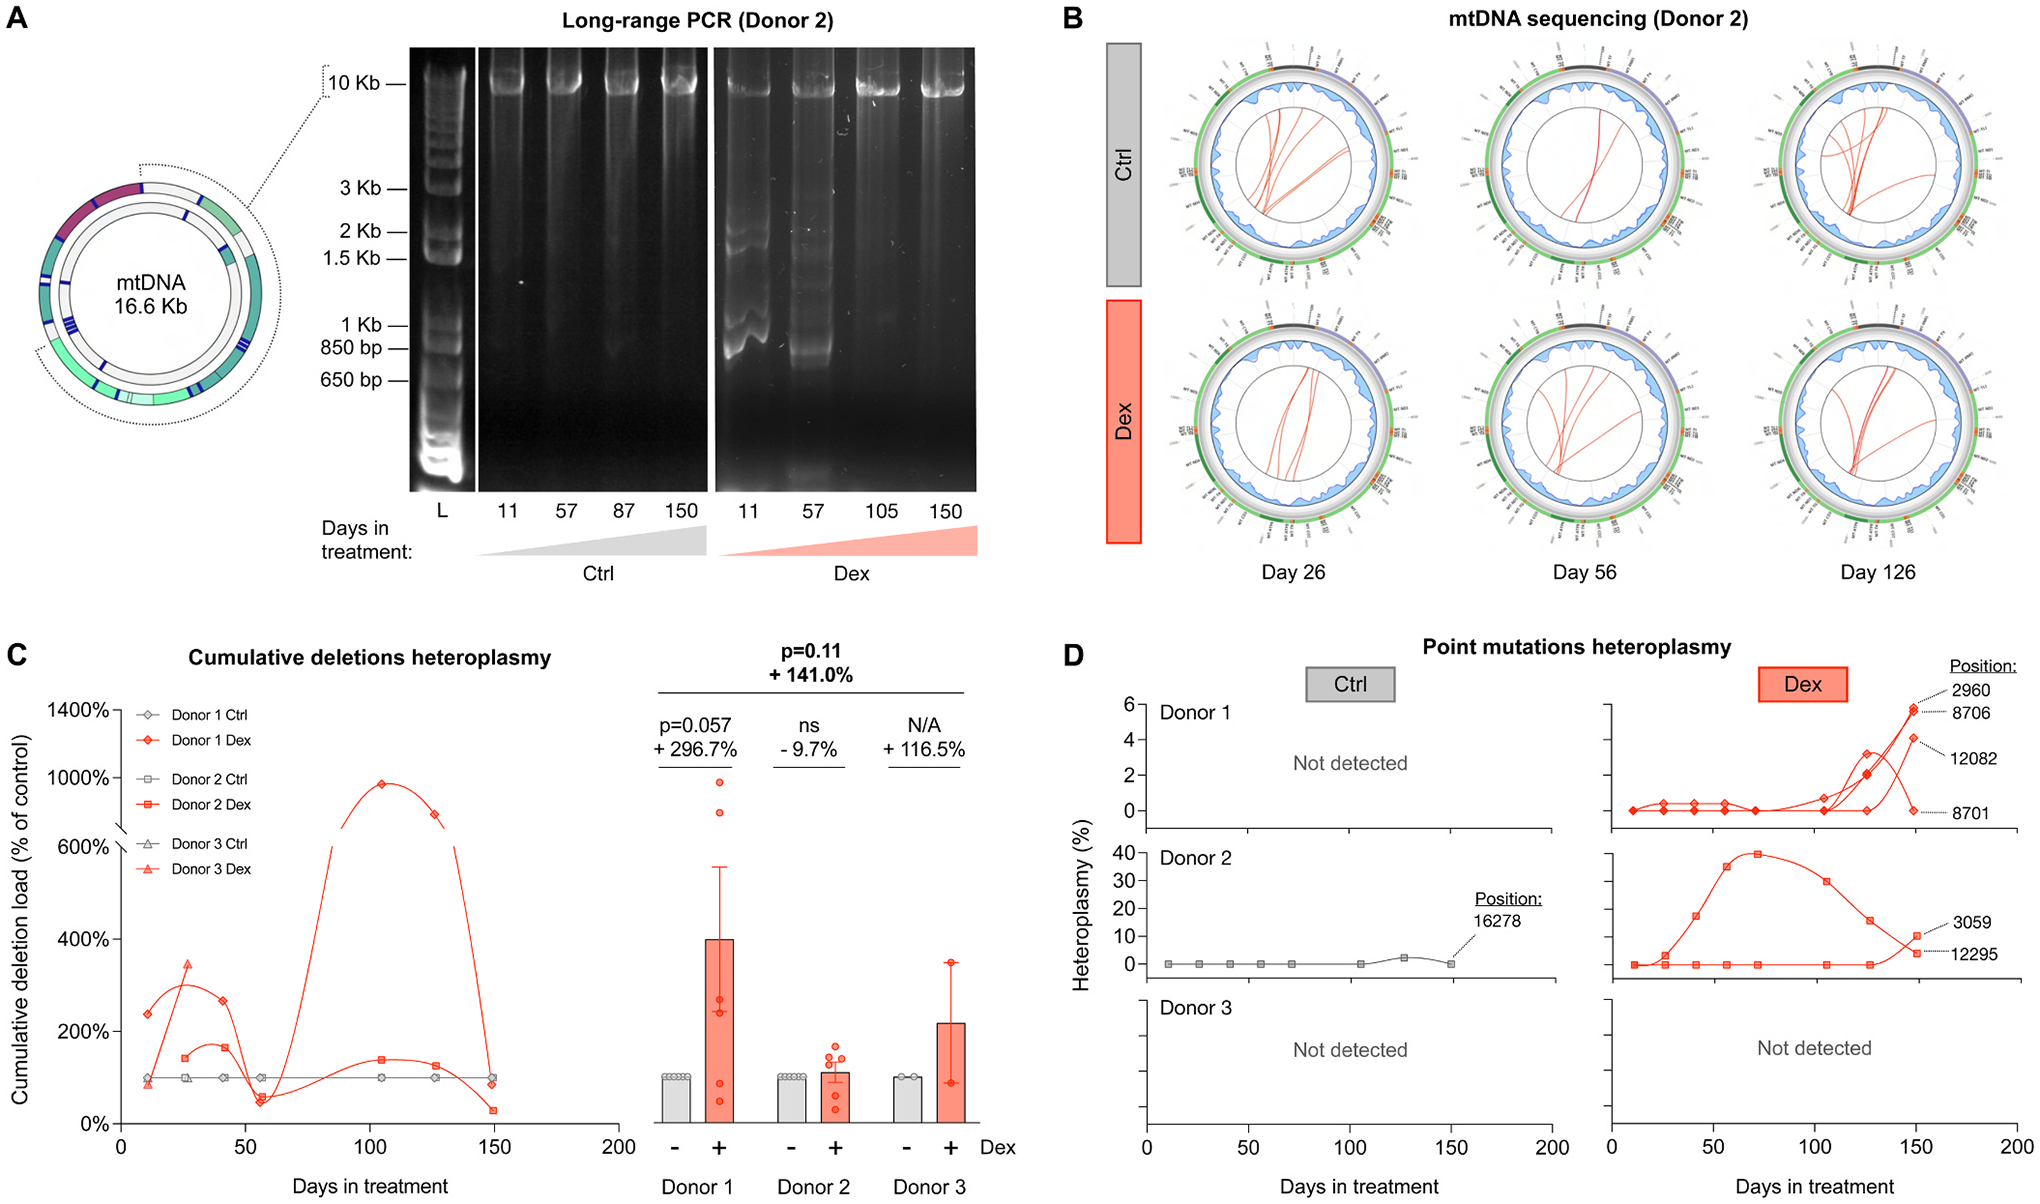
(A) Long-range PCR (10 kb product) of mtDNA extracted from Donor 2 control and Dex-treated cells across lifespan, resolved by agarose gel electrophoresis. The presence of amplicons of sizes smaller than 10 kb reveal the presence of mtDNA molecules containing deletions. (B) Circos plots from mtDNA sequencing and eKLIPse analysis for mtDNA extracted from Donor 2 control and Dex-treated cells at days 26, 56 and 126. Each red line represents an individual deletion that spans the sequence contained between its two ends. The line thickness reflects the level of relative abundance or heteroplasmy for each deletion (see Supplementary Material Fig. S8 for all donors). (C) Lifespan trajectories (left panel) and average effects (right panel) of Dex treatment on the cumulative heteroplasmy of all deletions present at a particular time point, expressed relative to the corresponding control time point for each donor. (D) Lifespan trajectories of individual point mutations heteroplasmy found in control (left panels) and Dex-treated cells (right panels) of the three donors. n = 3 donors per group, 2–8 timepoints per donor. Datapoints in lifespan trajectories are connected using the Akima spline curve, but the datapoints for Donor 3 in (C), for which due to insufficient time points the spline fit was not feasible and therefore datapoints were connected through a straight line. Lifespan average graphs are mean ± SEM, two-way ANOVA. ns: not significant, N/A: not applicable.