
Fig. 9. Hypermetabolism, not the metabolic shift towards OxPhos, predicts cell death.
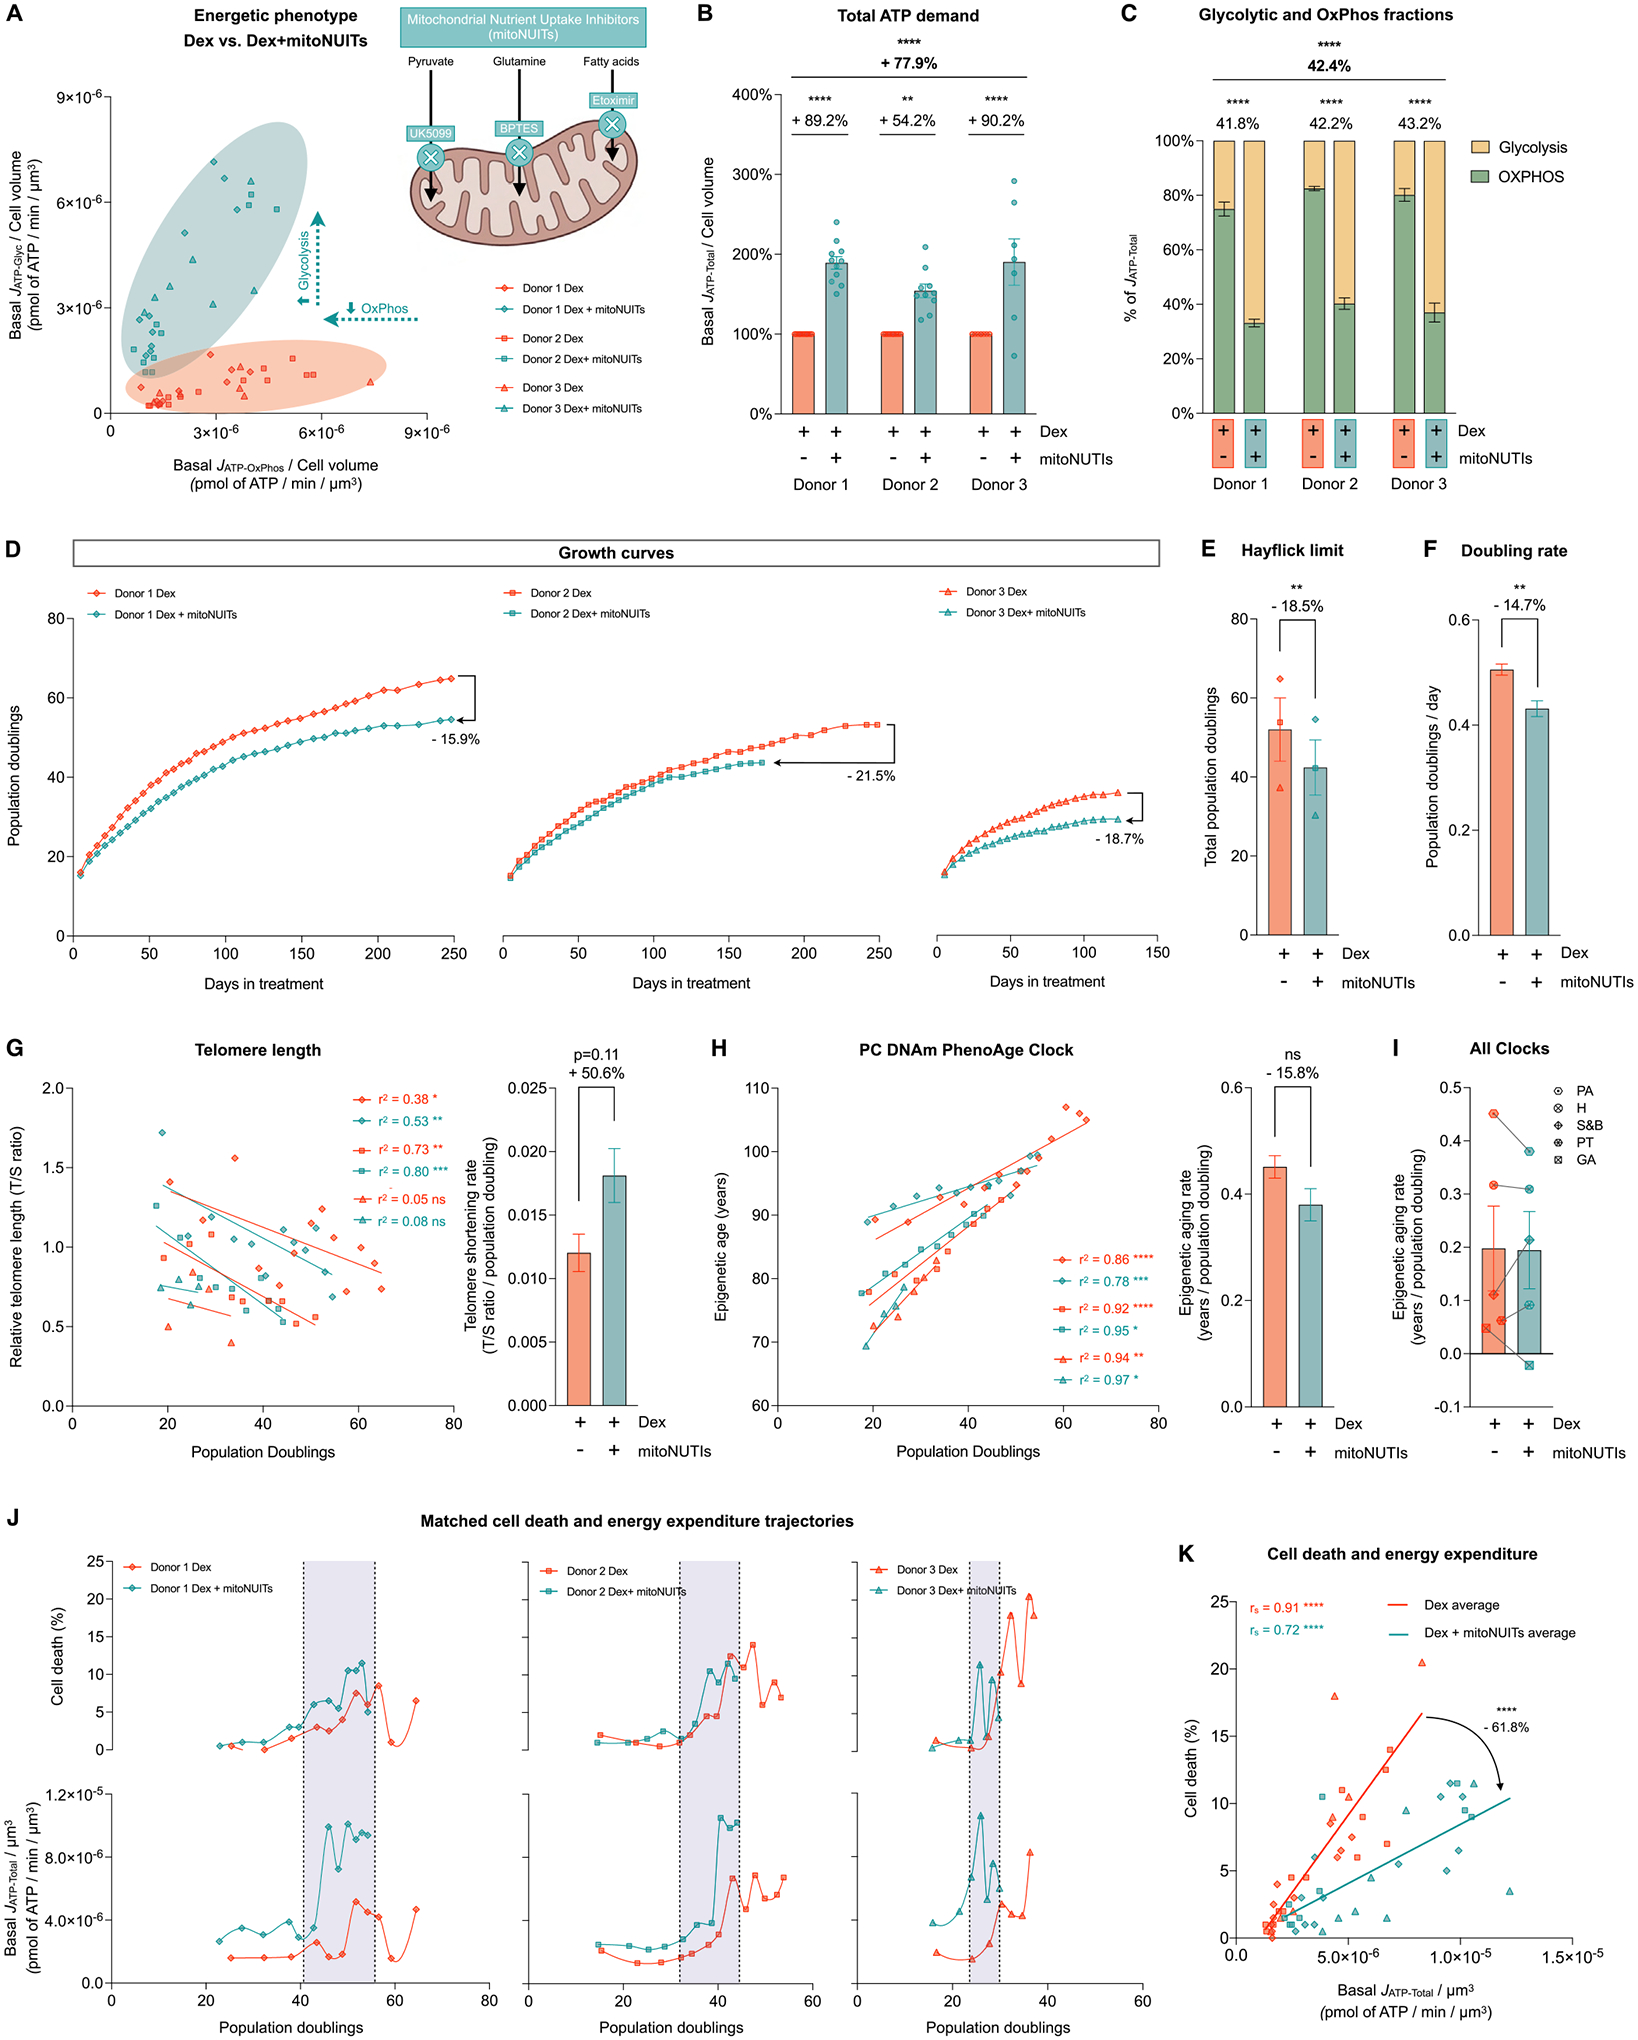
(A) Energetic phenotype of cells treated with Dex and Dex+mitoNUITs defined by Basal JATP-OxPhos/cell volume and Basal JATP-Glyc/cell volume across lifespan. (B) Lifespan average effects of Dex+mitoNUITs treatment on JATP-Total/cell volume. (C) Values across lifespan (left panel) and average effects (right panel) of basal JATP-Glyc (yellow) and basal JATP-OxPhos (green) expressed as percentage of basal JATP-Total. (D) Lifespan trajectories of cumulative population doublings. (E) Hayflick limit for each donor of each group. (F) Group averages of early life doubling rate, inferred by linear mixed model of the population doubling trajectories within the first 50 days of treatment. (G) Telomere length across population doublings, with simple linear regressions for each donor of each group (left panel), and group average telomere shortening rate inferred by linear mixed model along the whole lifespan (right panel). (H) Epigenetic age calculated by the principal components (PC)-adjusted PhenoAge epigenetic clock, with simple linear regressions for each donor of each group (left panel), and group average epigenetic aging rate inferred by linear mixed model along the whole lifespan (right panel). (J) Epigenetic aging rate for all the PC-adjusted epigenetic clocks evaluated: PA: Phene Age, H: Hannum, S&B: Skin and Blood, PT: Pan Tissue, GA: Grimm Age. (K) Percentage of dead cells (upper panels) and basal JATP-Total/cell volume (lower panels) across population doublings for Donor 1 (left panels), Donor 2 (middle panels) and Donor 3 (right panels). (H) Correlation between proportion of dead cells in every passage and Basal JATP-Total/cell volume. n = 3 donors per group; timepoints per donor: n = 7–11 in B-C, n = 26–36 in D, n = 4–14 in G-H, n = 8–13 in J-K. Lifespan average graphs are mean ± SEM, two-way ANOVA in B, Satterthwaite method in E, F, H, and I. Correlation graphs show Spearman r and thick lines represent simple linear regression for each group. * p < 0.05, * * p < 0.01, * ** p < 0.001, * ** * p < 0.0001, ns: not significant. mitoNUITs: Mitochondrial nutrient uptake inhibitors. JATP-Glyc: ATP production rate derived from glycolysis. JATP-OxPhos: ATP production rate derived from OxPhos. JATP-Total: algebraic sum of JATP-Glyc and JATP-OxPhos.