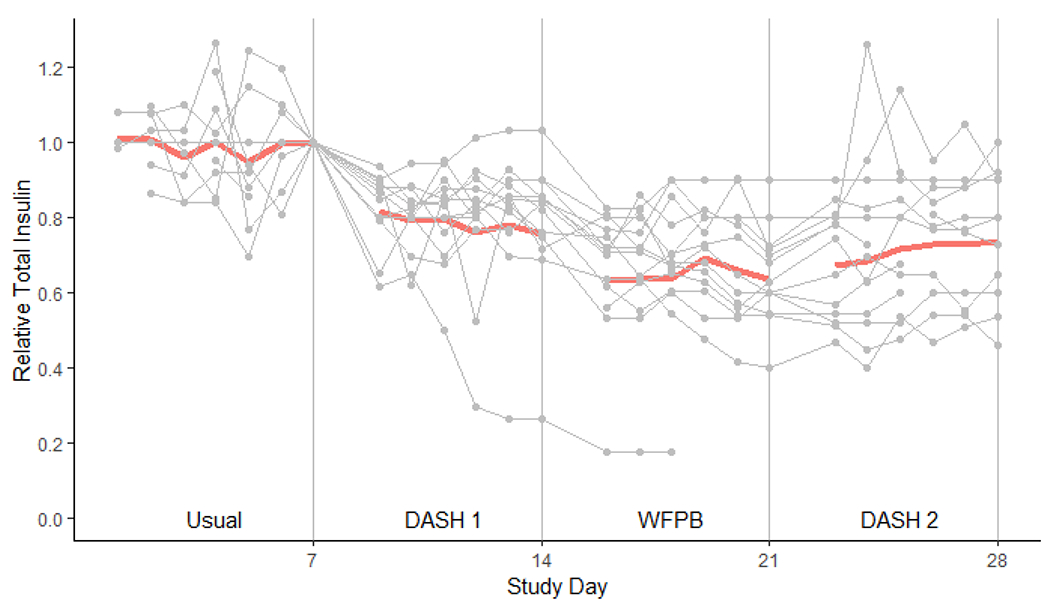
Figure 4. Relative Daily Insulin Usage During Four Study Phases.

Bold line denotes the geometric mean total daily insulin usage relative to the insulin dose at the end of the baseline week. Light gray lines with circles are trajectories of each individual participant. 1st day of each diet is omitted due to non-dietary influence of the OGTT.
