
Figure 4. Analysis of the Tspan15-catalytic domain (site B) interface.
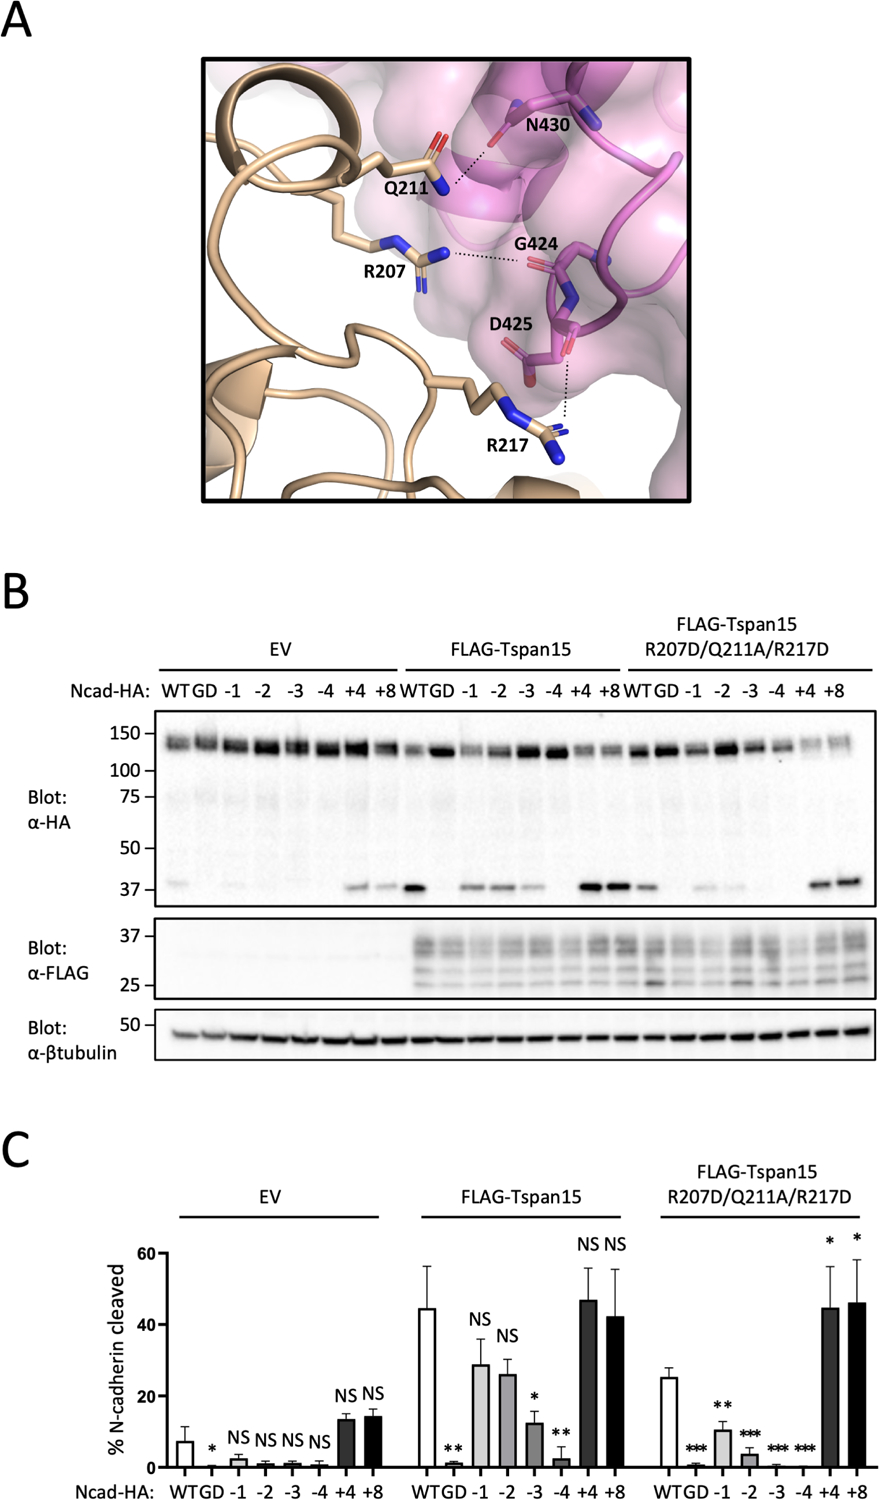
(A) View of the ADAM10-Tspan15 complex highlighting the residues mutated at the site B interface. Tspan15 is shown in beige, and that catalytic domain of ADAM10 is shown in magenta. Side chains of Tspan15 interface residues that were mutated (R207D, Q211A, and R217D) are shown as sticks. ADAM10 residues shown as sticks are within H-bonding distance (dashed lines) of Tspan15. (B) N-cadherin cleavage assay analyzing the Tspan15 site B interface mutant. Tspan15 knockout U251 cells were transfected with vector control (EV), FLAG-tagged wild-type Tspan15 or the Tspan15 site B interface mutant, and with one of the HA-tagged Ncad variants. Cells were lysed after 48 hours, and blotted with anti-HA to determine the extent of cleavage, and with anti-FLAG to confirm Tspan15 protein expression. Lysates were also blotted with anti-β-tubulin (bottom) as a loading control. Data are representative of three independent biological replicates. (C) Quantification of N-cadherin cleavage using the Western blot results from all replicates. Blots were quantified using ImageJ software. Error bars indicate mean ± standard deviation of three independent experiments. Statistical analysis was performed in GraphPad Prism 7 using an unpaired t test (two-tailed). * p< 0.05; ** p<0.01; *** p<0.001. See also Figure S5.