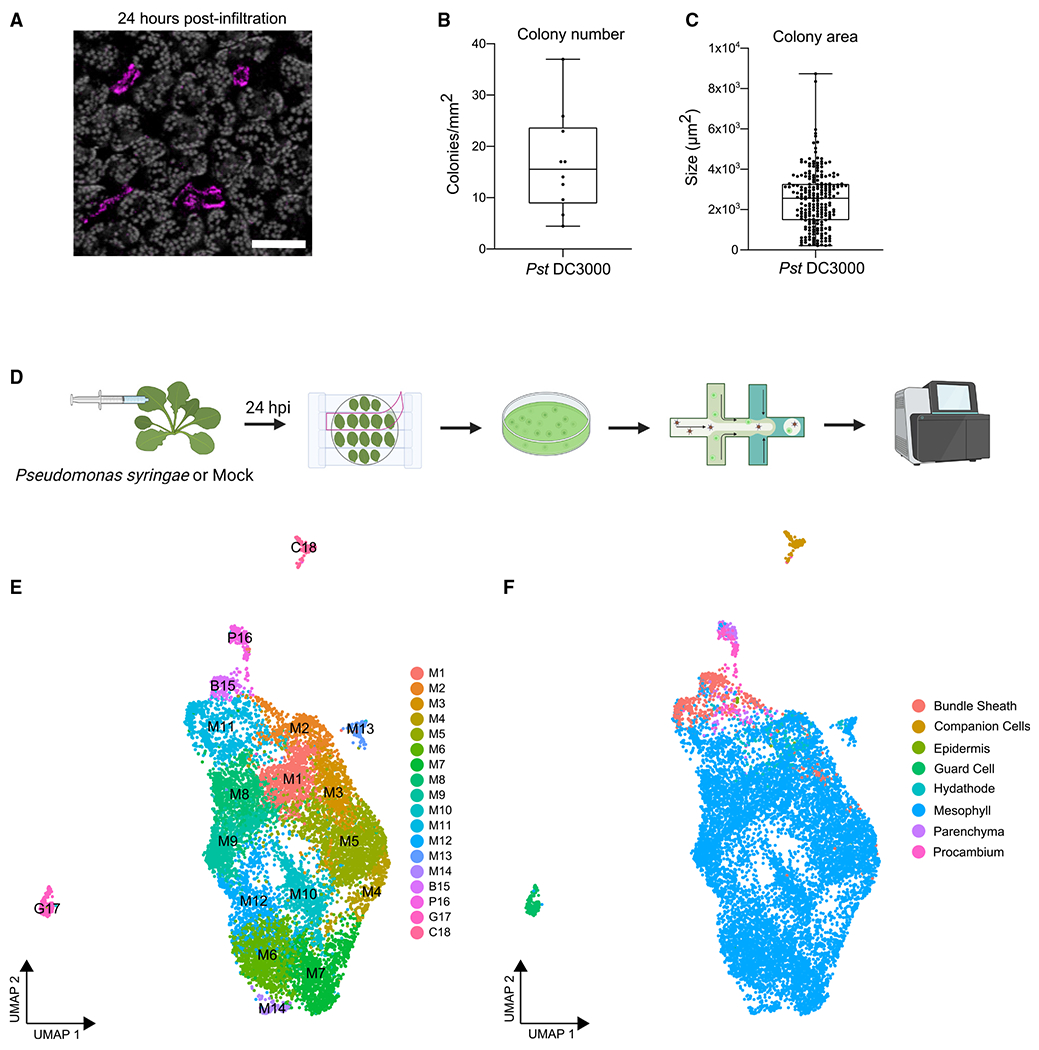
Figure 1. Single-cell RNA-seq profiling of Arabidopsis infected with Pseudomonas syringae.

(A) Confocal micrograph of a representative image of an Arabidopsis leaf 24 h post-infiltration (hpi) with mCherry-tagged Pst DC3000 ΔhopQ1 (Pst DC3000). The image is a maximum projection from 21 confocal z stacks. Chlorophyll autofluorescence is shown in gray. Scale bar: 100 μm.
(B and C) Pst DC3000 colony number and area in infiltrated leaf tissue shown in (A). Boxplot shows median with minimum and maximum values indicated (n = 10 images from 4 plants).
(D) Overview of the scRNA-seq experiment. Four-week-old Arabidopsis Col-0 was infiltrated with Pst DC3000 or 10 mM MgCl2. Twenty-four hours post-infiltration, protoplasts were prepared using the Tape-Arabidopsis Sandwich method. Cells were isolated on the 10X Genomics Chromium chip and sequenced using the Illumina NovaSeq6000 platform.
(E and F) Single-cell uniform manifold approximation and projection (UMAP) plots from both Pst DC3000 and mock-treated samples, colored according to cluster identities (E) and cell types (F). M, mesophyll; B, bundle sheath; P, parenchyma and procambium; G, guard cells; C, companion cells.
See also Figures S1 and S2 and Tables S1A and S2.
