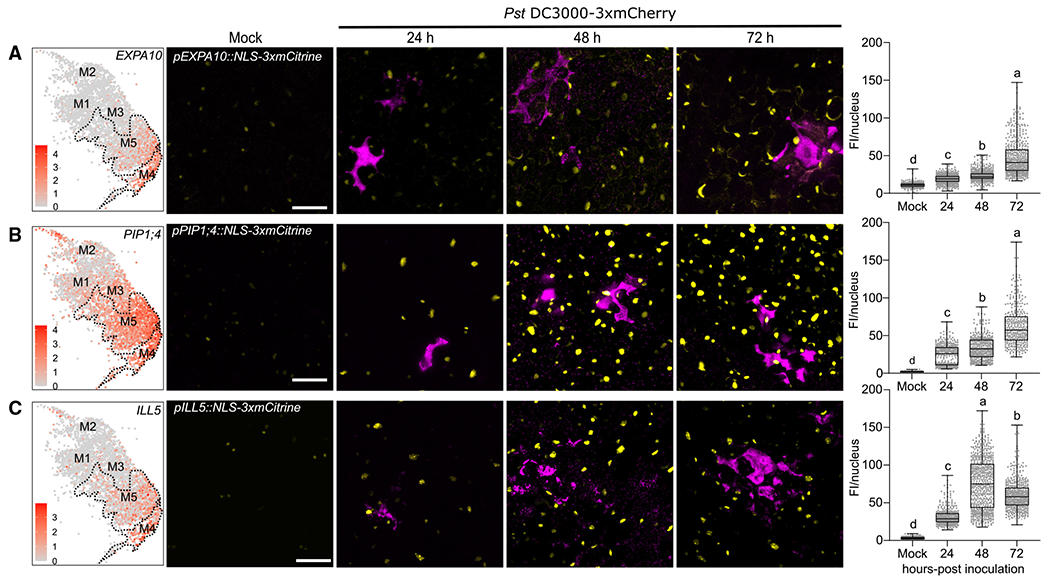
Figure 4. Temporal dynamics of susceptible marker expression during Pseudomonas infection.

(A–C) The susceptible markers EXPA10 (A), PIP1;4 (B), and ILL5 (C) are highly induced at late infection stages. Promoter-reporter lines for each marker were generated by fusion to a 3xfluorophore possessing a nuclear localization signal (NLS). Left: feature plot of susceptible markers in pathogen-responsive clusters. Dashed line outlines clusters M4 and M5. Middle: representative images of susceptible marker expression at different infection stages. Two-week-old Arabidopsis seedlings grown on Murashige-Skoog plates were surface-inoculated with mCherry-tagged Pst DC3000, and mock images were taken at 24 h. Pictures are maximum projections from confocal z stacks. Right: mean florescence intensity (FI; mean gray values) per nucleus was calculated and boxplot shows median with minimum and maximum values indicated (n = 6 images from 3 plants). Different letters indicate statistically significant differences (p < 0.0001, ANOVA with Tukey test). All experiments were repeated at least two times with similar results. Scale bars: 25 μm.
See also Figure S6.
